For 48-722: Building Performance Modelling
By Afshan Rehman, Xianlong Xia and Yaxian Zheng
Part-1: Conceptual Energy Analysis
In this part, we run conceptual energy analysis (CEA) on a shoe box model created on REVIT to understand the effect of orientation, form, building envelope, etc on the energy use intensity and how they can help us make early design decisions.
By keeping the building footprint and height constant we work with different forms and orientations and analyse how massing plays a role on a buildings total energy performance. We run this experiment for 2 cities with 2 extreme climates - Pittsburgh and Miami.
Changes in EUI based on Building Form
By using these two cities we are able to understand how a building with more heating degree days requires a different building construction from a city with more cooling degree days despite both showing the need for insulation - one to keep the heat in and one to keep the heat out.
We make a few baseline assumptions for an office building and change the form, window to wall ratio, wall assembly, roof assembly, slab assembly, window glazing properties, orientation and shading depth to arrive at the best design option.
We also compare these values to the baseline model and national benchmarks like ASHRAE and IECC to understand where we stand and how much impact a designer's decision can make.
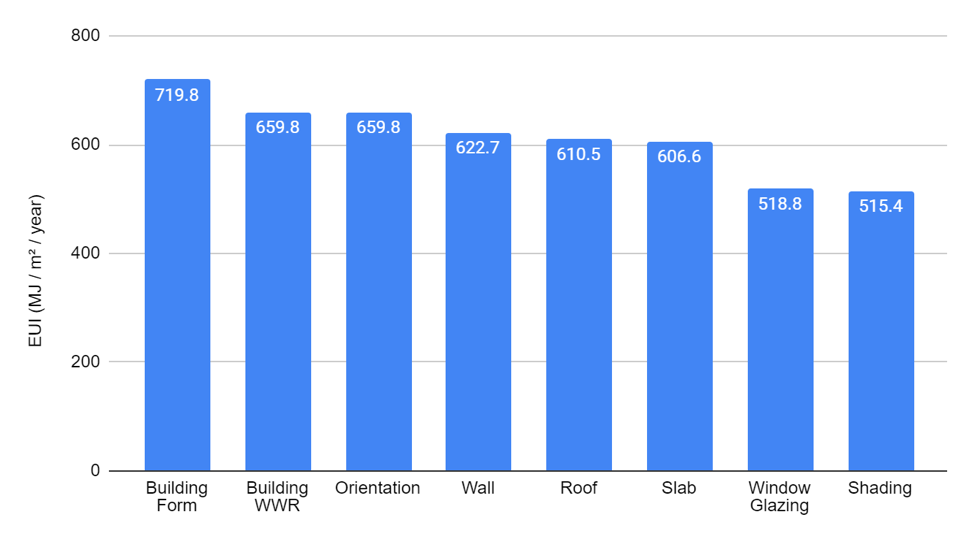
EUI Reduction for Pittsburgh
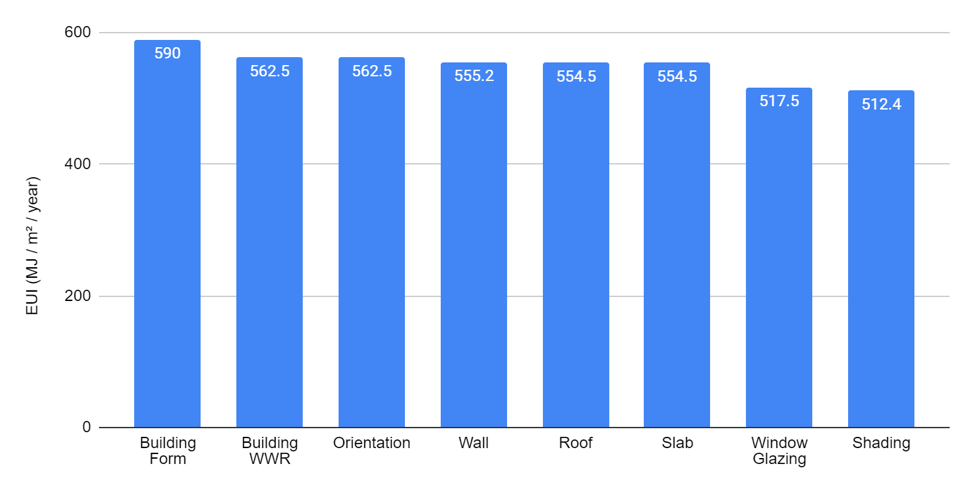
EUI Reduction for Miami
Part-2: building energy model on ies-ve
In this part of the study, we perform energy simulations to get familiarised with IES-VE. We take the Energy Information Centre in Pittsburgh as a building case.
We run the simulations in 2 parts - Baseline and Best Case. This model is used as a guideline to measure the effect that modifications on roof, wall, floor, slab constructions; equipment, occupancy, lighting densities and scheduling have on the final EUI. The values for each are changed parametrically one-factor at a time and the best values are combined to develop a final best performing case building energy model.
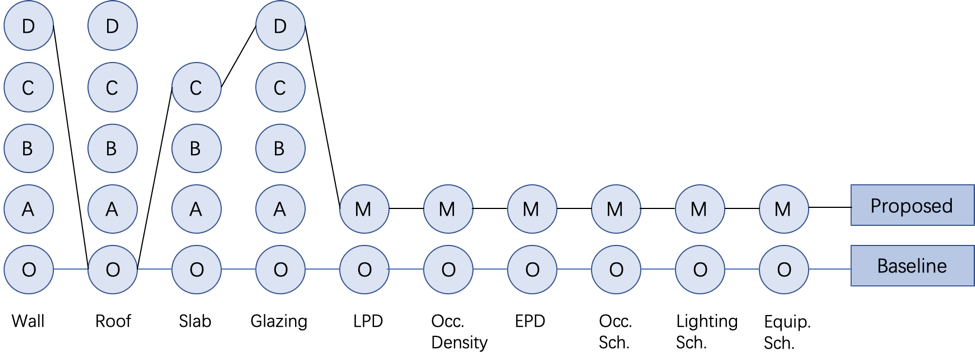
Steps involved in energy analysis using IES-VE
The final energy performance simulation results show a decrease in EUI by 1.08% from the baseline model. Though the change is not great, when the loads are observed individually the most reduction can be seen in cooling loads of 7.6% followed by equipment load of 2.9%. Because the cooling loads are reduced, the annual electricity consumption reduces by 2.5%.
Part-3: hvac design on design builder/energy plus
In this part we study the detailed and advanced effects of site and weather data on zoning, operations and schedules, construction assembly and HVAC design. Two types of HVAC systems are modelled. One is the baseline HVAC with “CAV reheat with a boiler and air-cooled chiller” and an alternative HVAC system with “VAV terminal reheat with a boiler and water-cooled chiller”. Both the HVAC models are simulated with both the construction assemblies. The four results are compared to understand how HVAC design and building envelope design plays a great role in energy consumption.
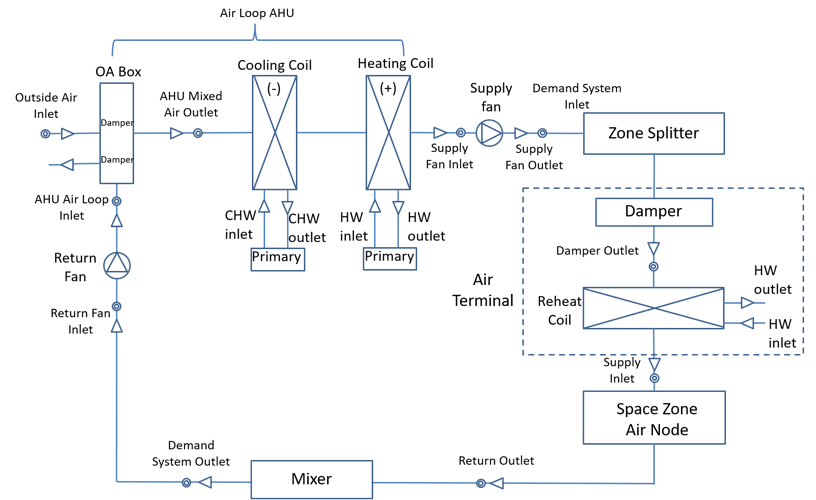
Nodal Diagram of a VAV System
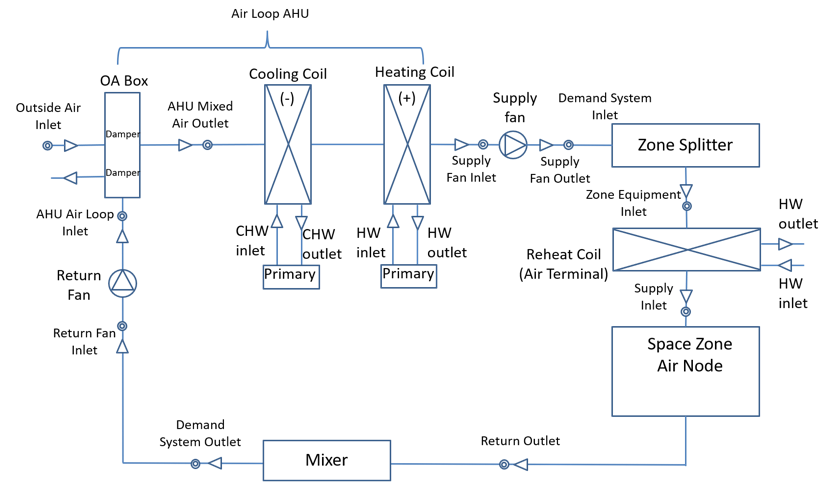
Nodal Diagram of a CAV System
The difference between the two systems is that the CAV system has constant air volume for each zone, and when the load changes it changes the temperature of supply air instead of the volume. Compared with the VAV system, the CAV system has no damper in its air terminal.
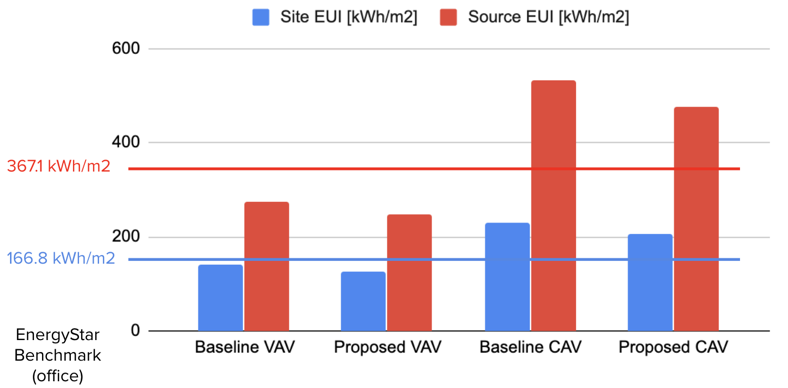
EUI values of VAV vs. CAV models
The model with original envelope design and CAV system shows the most energy consumption compared with the other three models, with source EUI of 532.2 kWh/m2. Compared with this mode, the optimised enclosure alone could reduce the EUI by 10.8% and the utilisation of the VAV system could reduce the EUI by 48.3%.