For 48-733: Environmental Performance Simulations
By Afshan Rehman, Amulya Surapaneni, Ishwar Prasad Balaji and Mingyang Kong
The objective of this study is to be able to study, understand, quantify and analyse the effects of sun, wind, daylighting, thermal radiation on the interior and exterior of a building using Environmental Performance Tools. The building chosen for the study is Margaret Esherick house, designed by Louis Kahn in 1961. With the advancement in the building performance simulation tools we can model the internal and external conditions of a building in order to predict its physical performance in terms of energy use, energy gains /losses, comfort conditions etc. In order to do so, a certain set of computer-based programs like Rhino, Grasshopper, DIVA, ArchSim, EnergyPlus and Ladybug are used to analyse the Esherick house.
PART-1: extracting climate data
The figures below represents use of the ladybug plugin to represent the hourly dry bulb temperature and relative humidity sourced from the Philadelphia-NE Philadelphia AP 724085 (TMY3) epw file in 2D graphs.
Annual Dry Bulb Temperature and Dry Bulb Temperature between 21-27 degrees celsius | Annual Relative Humidity and Annual Relative Humidity between 30%-70%
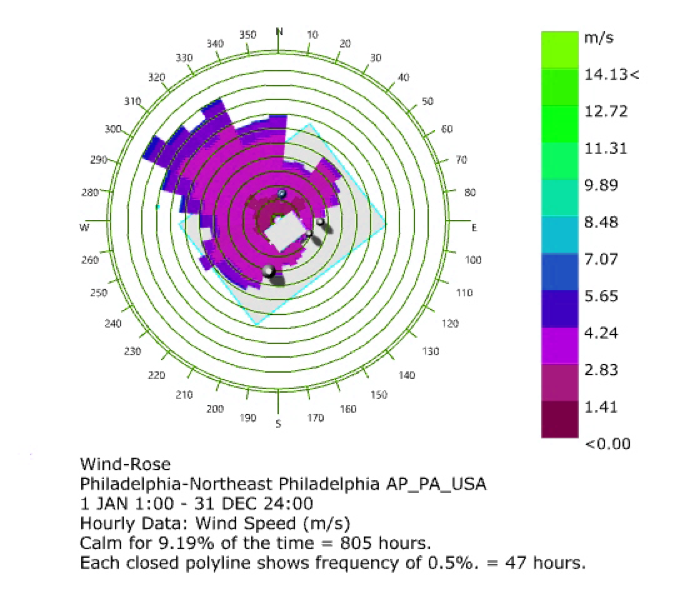
Wind Rose Mesh
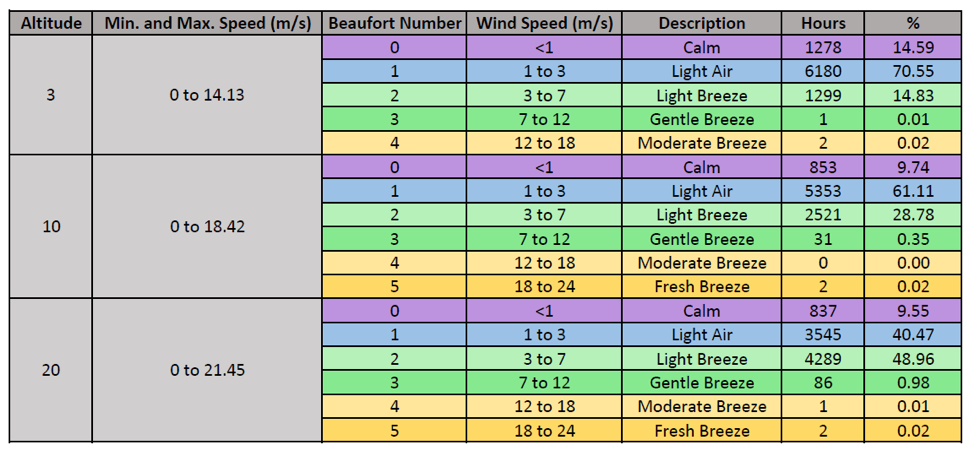
Wind Speed Breakup / Hour / Altitude
From the derived data, we study that more than 50% of the wind has a speed of 1-3 m/s. As the altitude increases, there is lighter breeze. There are no cases of strong gale or storms.
Area on the ground plane receiving more than 6-hours of direct
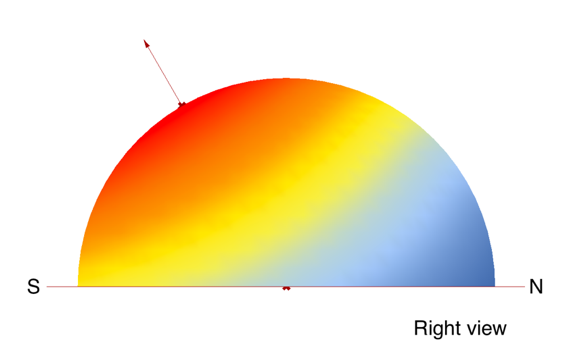
Solar Calla Dome
80.8% of the ground plane received more than 6-hours of direct sunlight when the trees on the site were not considered in the analysis. Whereas, only about 58.5% of the ground plane received more than 6-hours of direct sunlight when the trees were considered in the analysis.
The Ladybug Radiation Calla Dome returns the maximum solar radiation at 1579.27 kWh/m2. This maximum occurs when horizontal rotation angle (HRA) is 180°, and the vertical rotation angle (VRA) is 60°.
part-2: solar radiation study
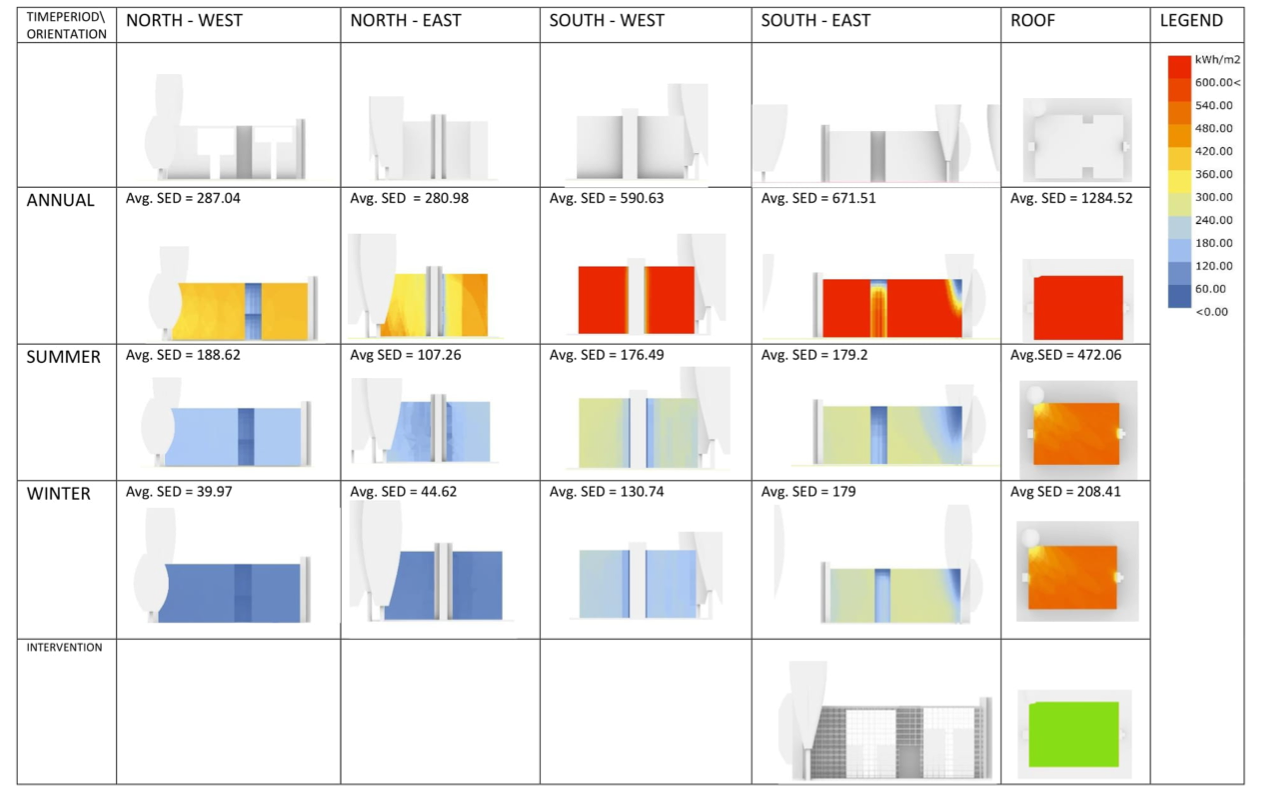
Cumulative Sky Matrix
Radiation Analysis for different orientations
The matrix above are the results of the ladybug SED plugin representing the data on the faces of the modelled building. It shows the south west and East faces of the building with the highest SEDs during the time periods, apart from the roof. The suggested intervention is and unobtrusive egg-crate screen on the SE and SW faces and a green roof to mitigate high levels of incident solar radiation.
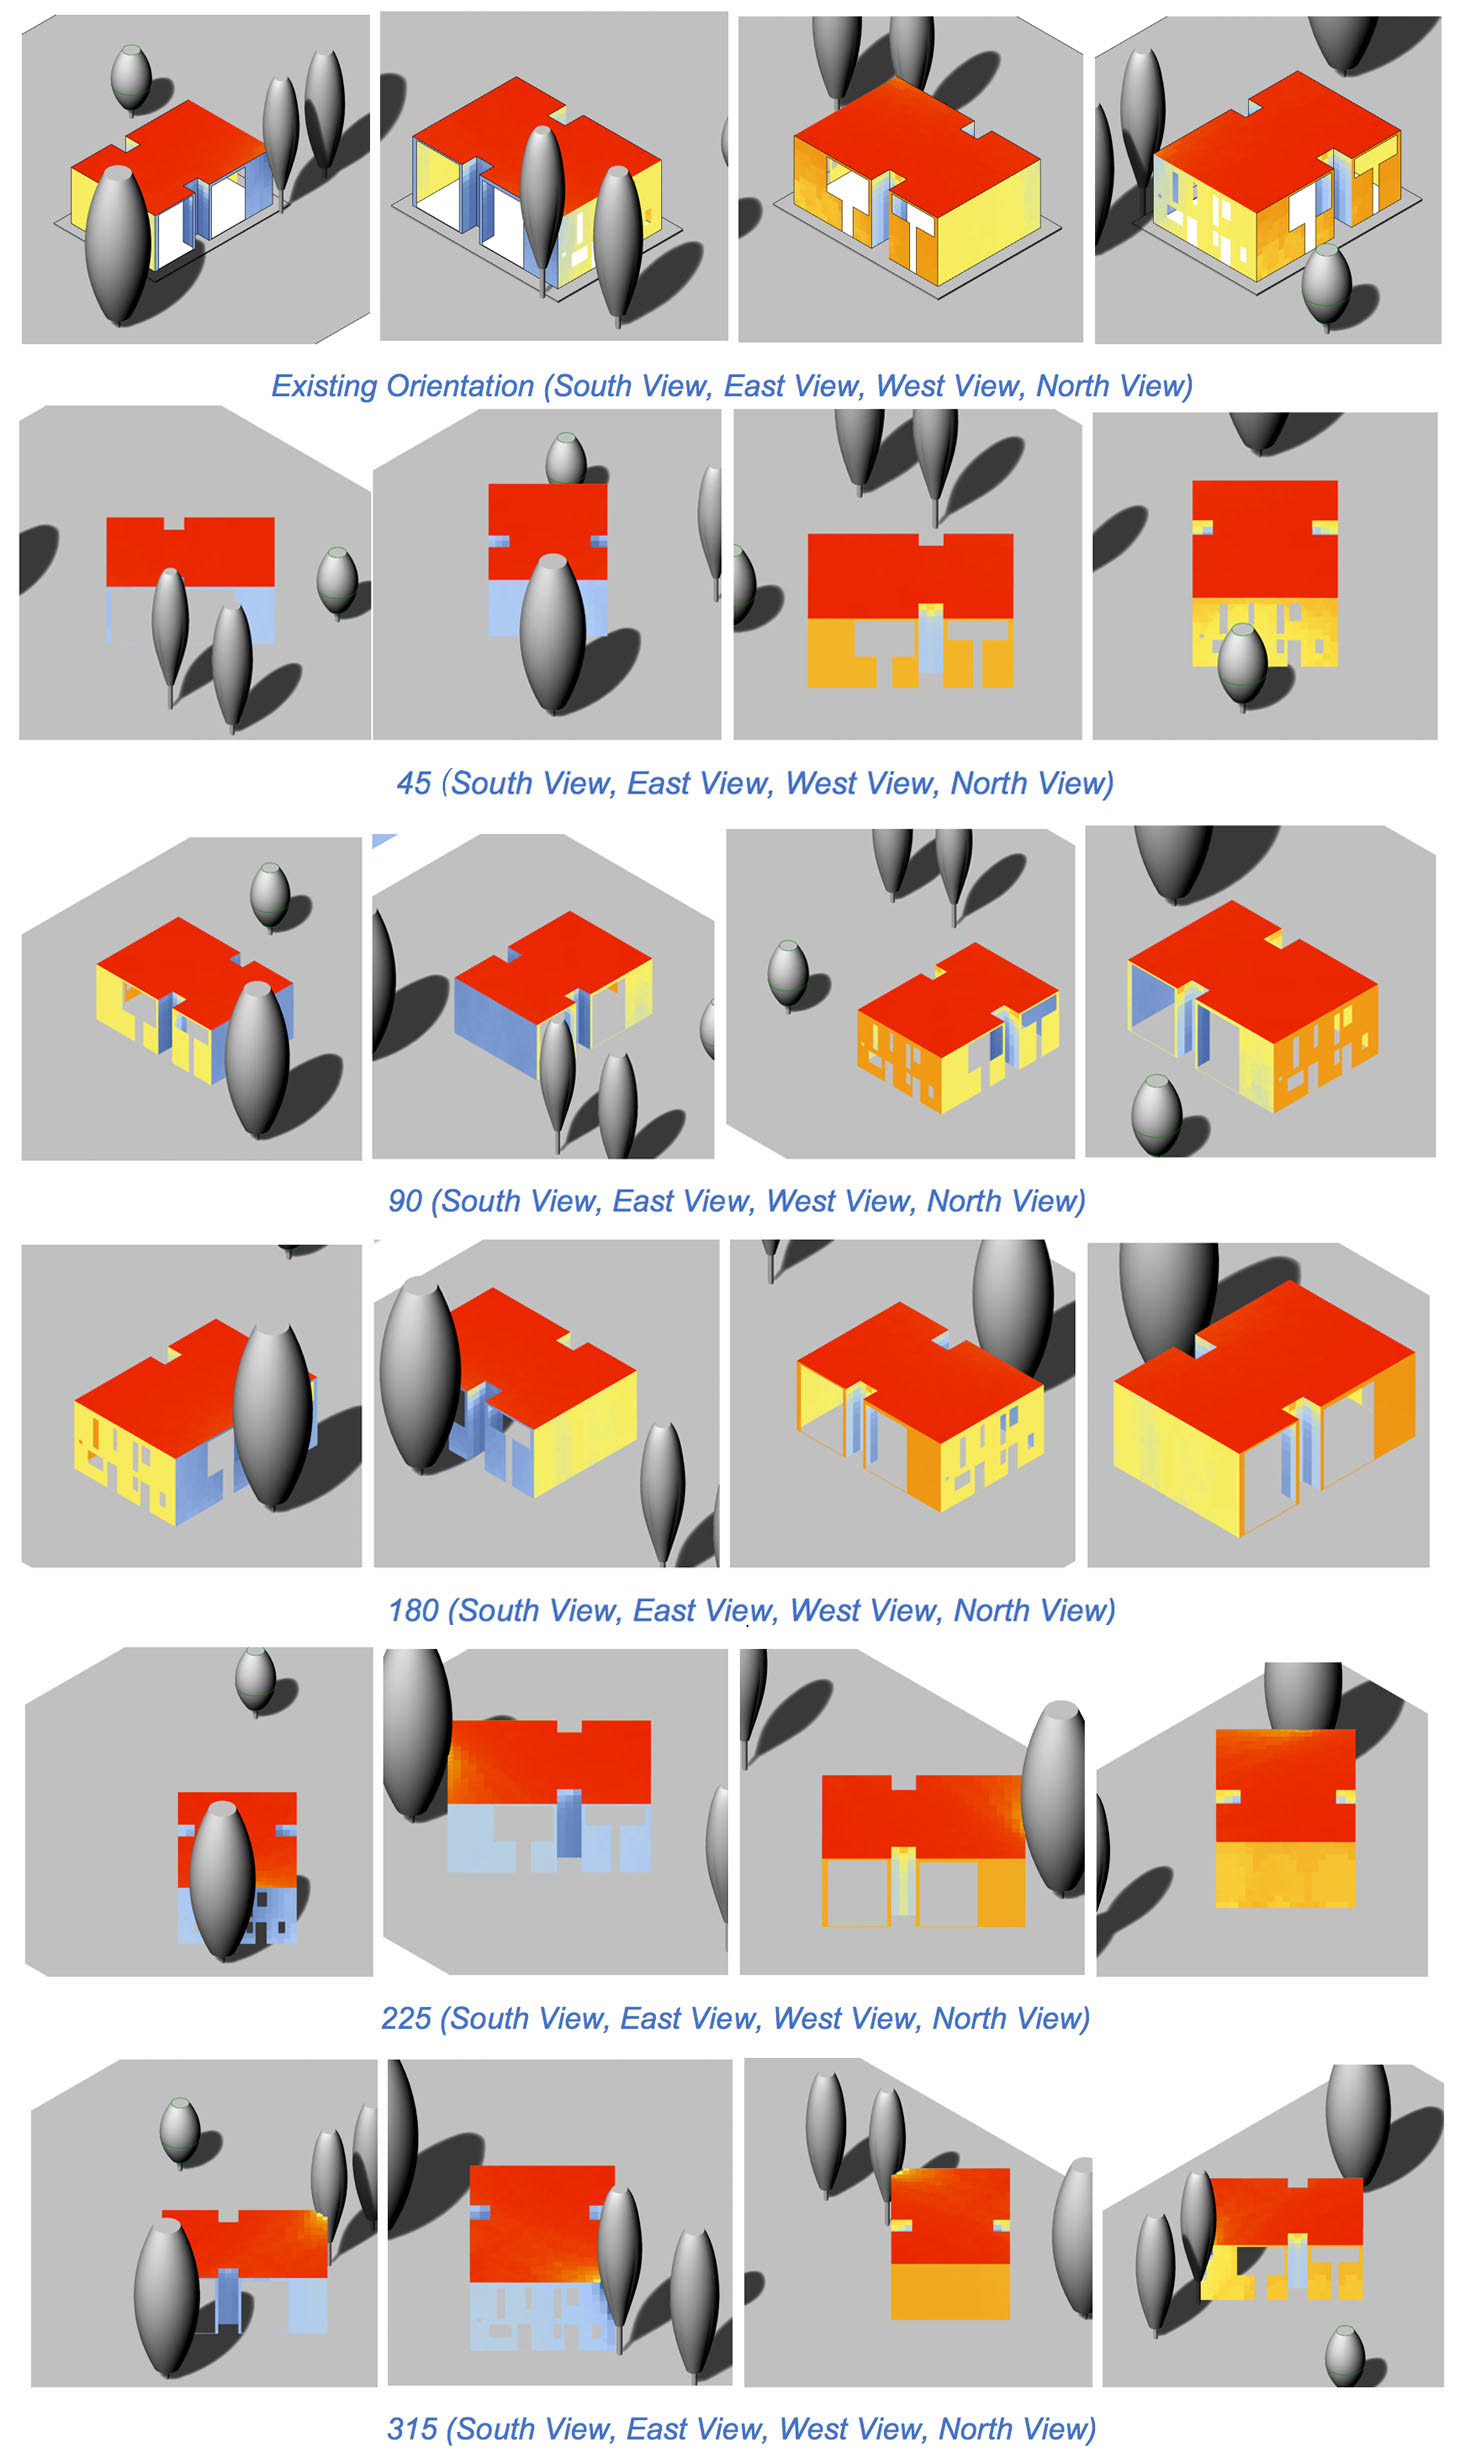
By keeping the centre of the floor constant, and rotating the geometry by 45° we get 8 other orientations with different solar radiation values. By comparing the values we get the 4 best orientation suggestion.
Since the plan of the building is almost a square, the maximum and minimum radiation remains the same. The roof is flat and receives the maximum radiation. But the radiation received by each outdoor wall differs. The 4 best orientations for the house would be 0°, 45°, 135° and 180°.
part-3: visible radiation study
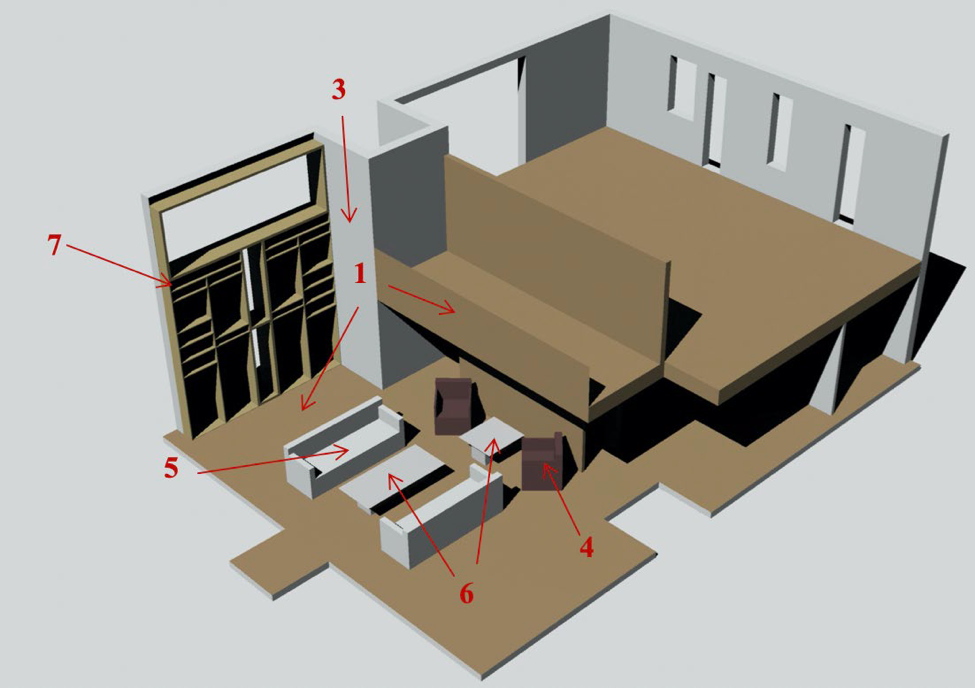
Interior design has an impact on building indoor visual comfort, especially indoor element material. The colour, texture, and reflectivity of materials will affect the daylight reflection and form different visual effects. The visible radiation simulation study is conducted based on the real home improvement materials of the Living Room in Esherick House.
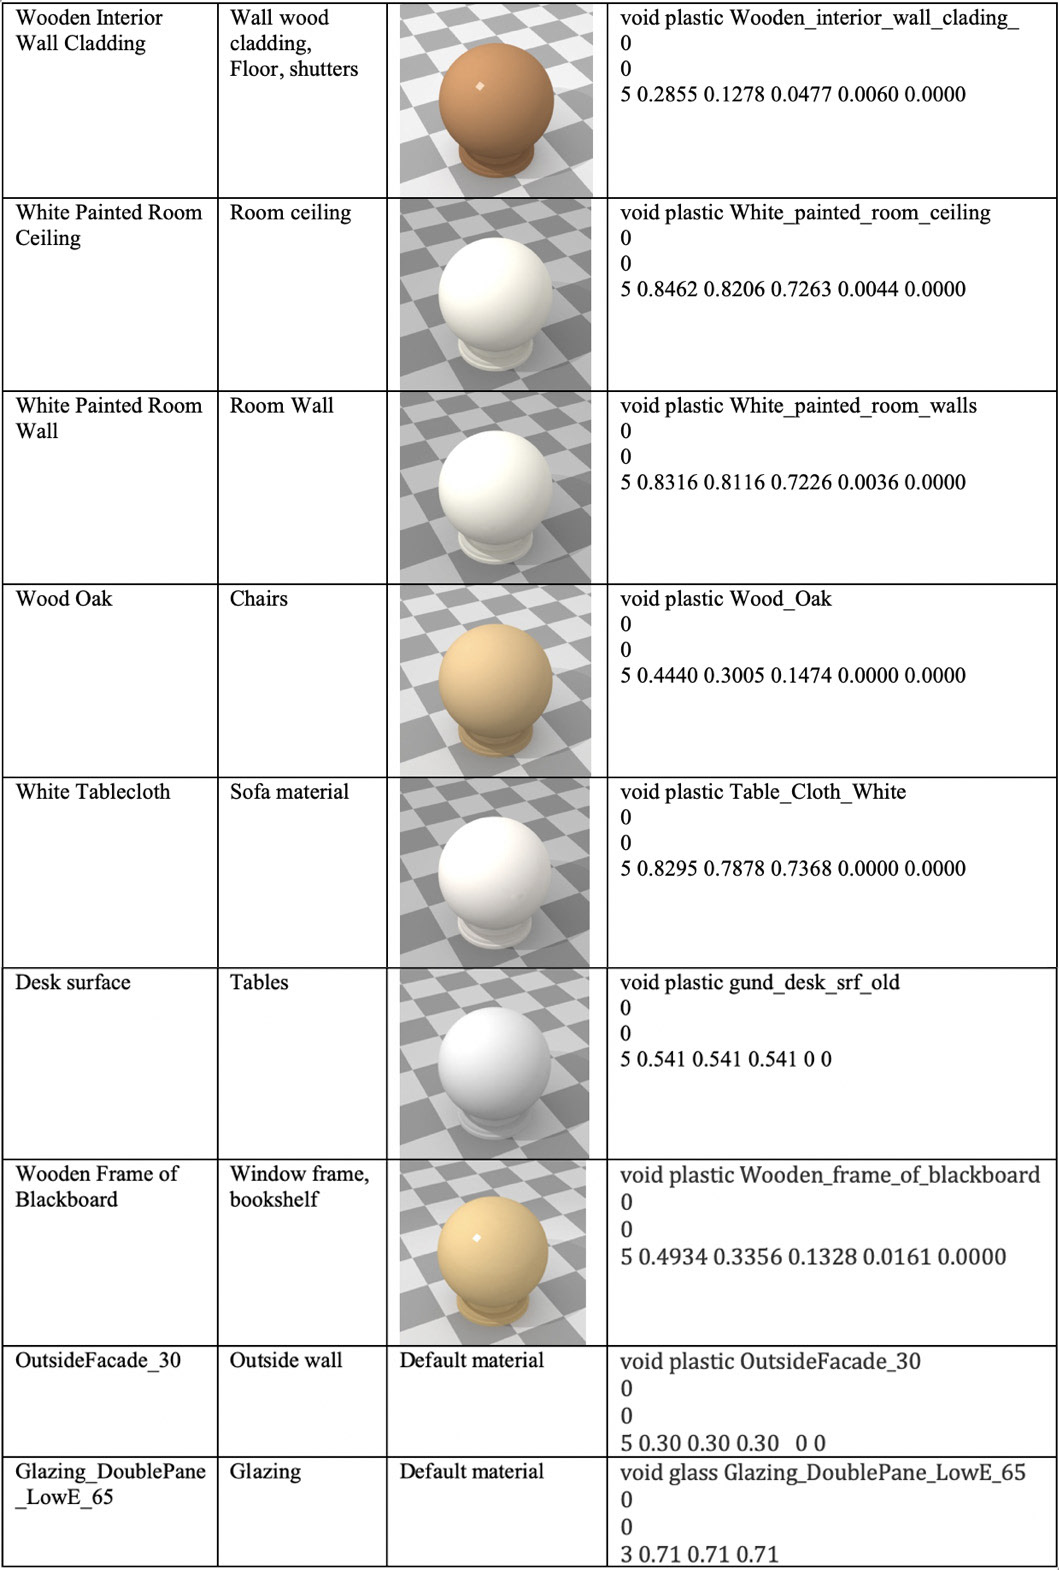
The visible radiation studies are done based on 3 metrics:
- Illuminance Based Metrics: Daylight Factor (DF) & Illuminance (E)
- Climate Based Metrics: Spatial Daylight Autonomy(sDA), Annual Sunlight Exposure (ASE), Useful Daylight Illuminance (UDI)
- Luminance-Based Metrics: Unified Glare Rating (UGR), Visual Comfort Probability (VCP), Daylight Glare Probability (DGP)
Daylight Factor (DF):
The average Daylight Factor (DF) Distribution of this space is 5.43%, which exceeds the threshold of 2% to 5%. The range of DF is from 0 to 20.4.
The average Daylight Factor (DF) Distribution of this space is 5.43%, which exceeds the threshold of 2% to 5%. The range of DF is from 0 to 20.4.
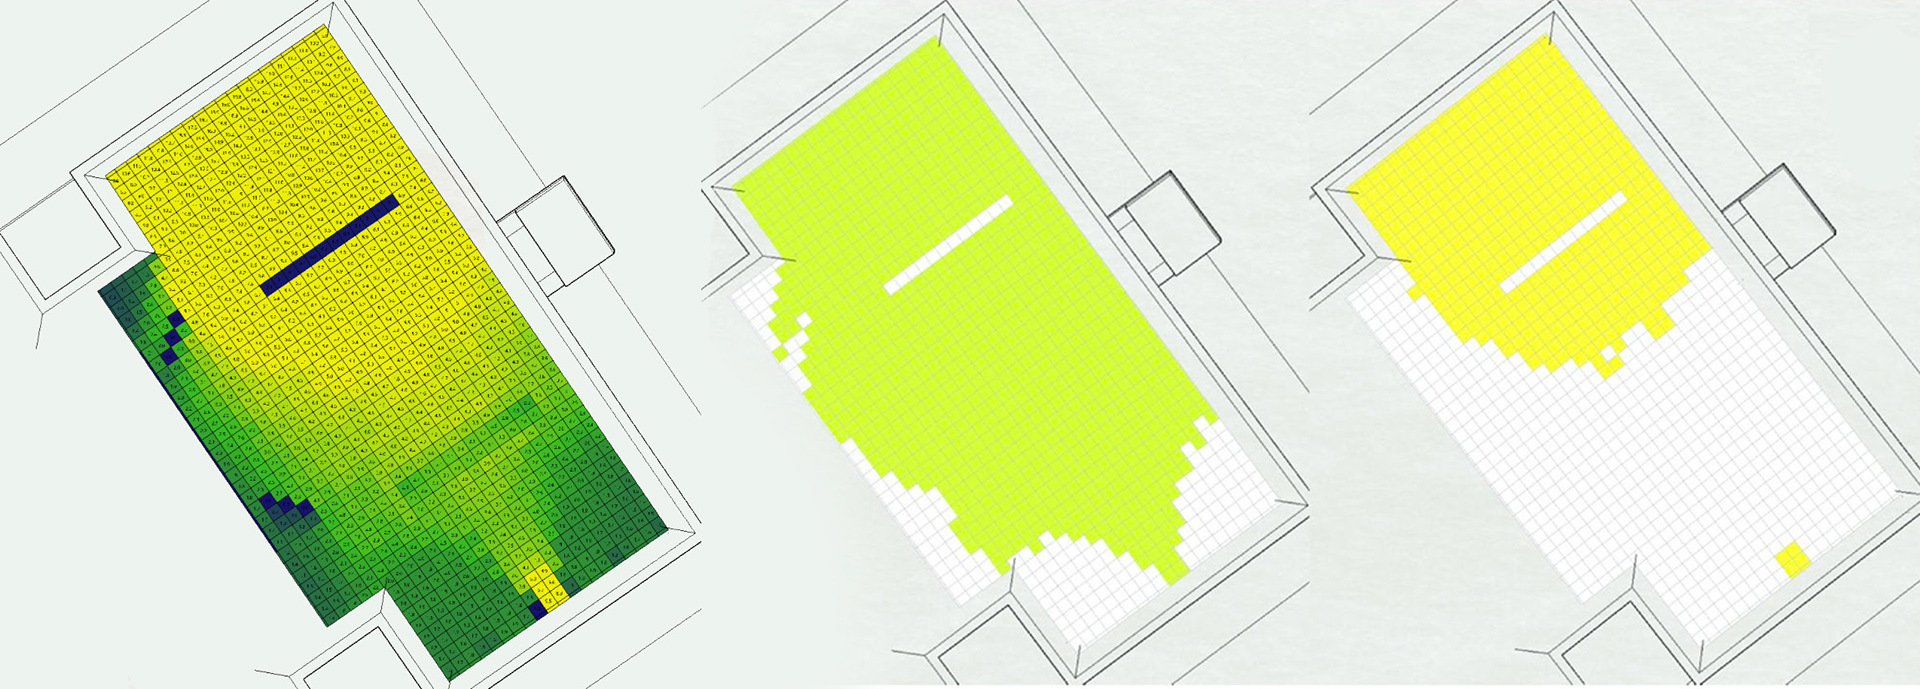
(L to R): Base model with DF Distribution, Area with DF > 2%, Area with DF > 5%
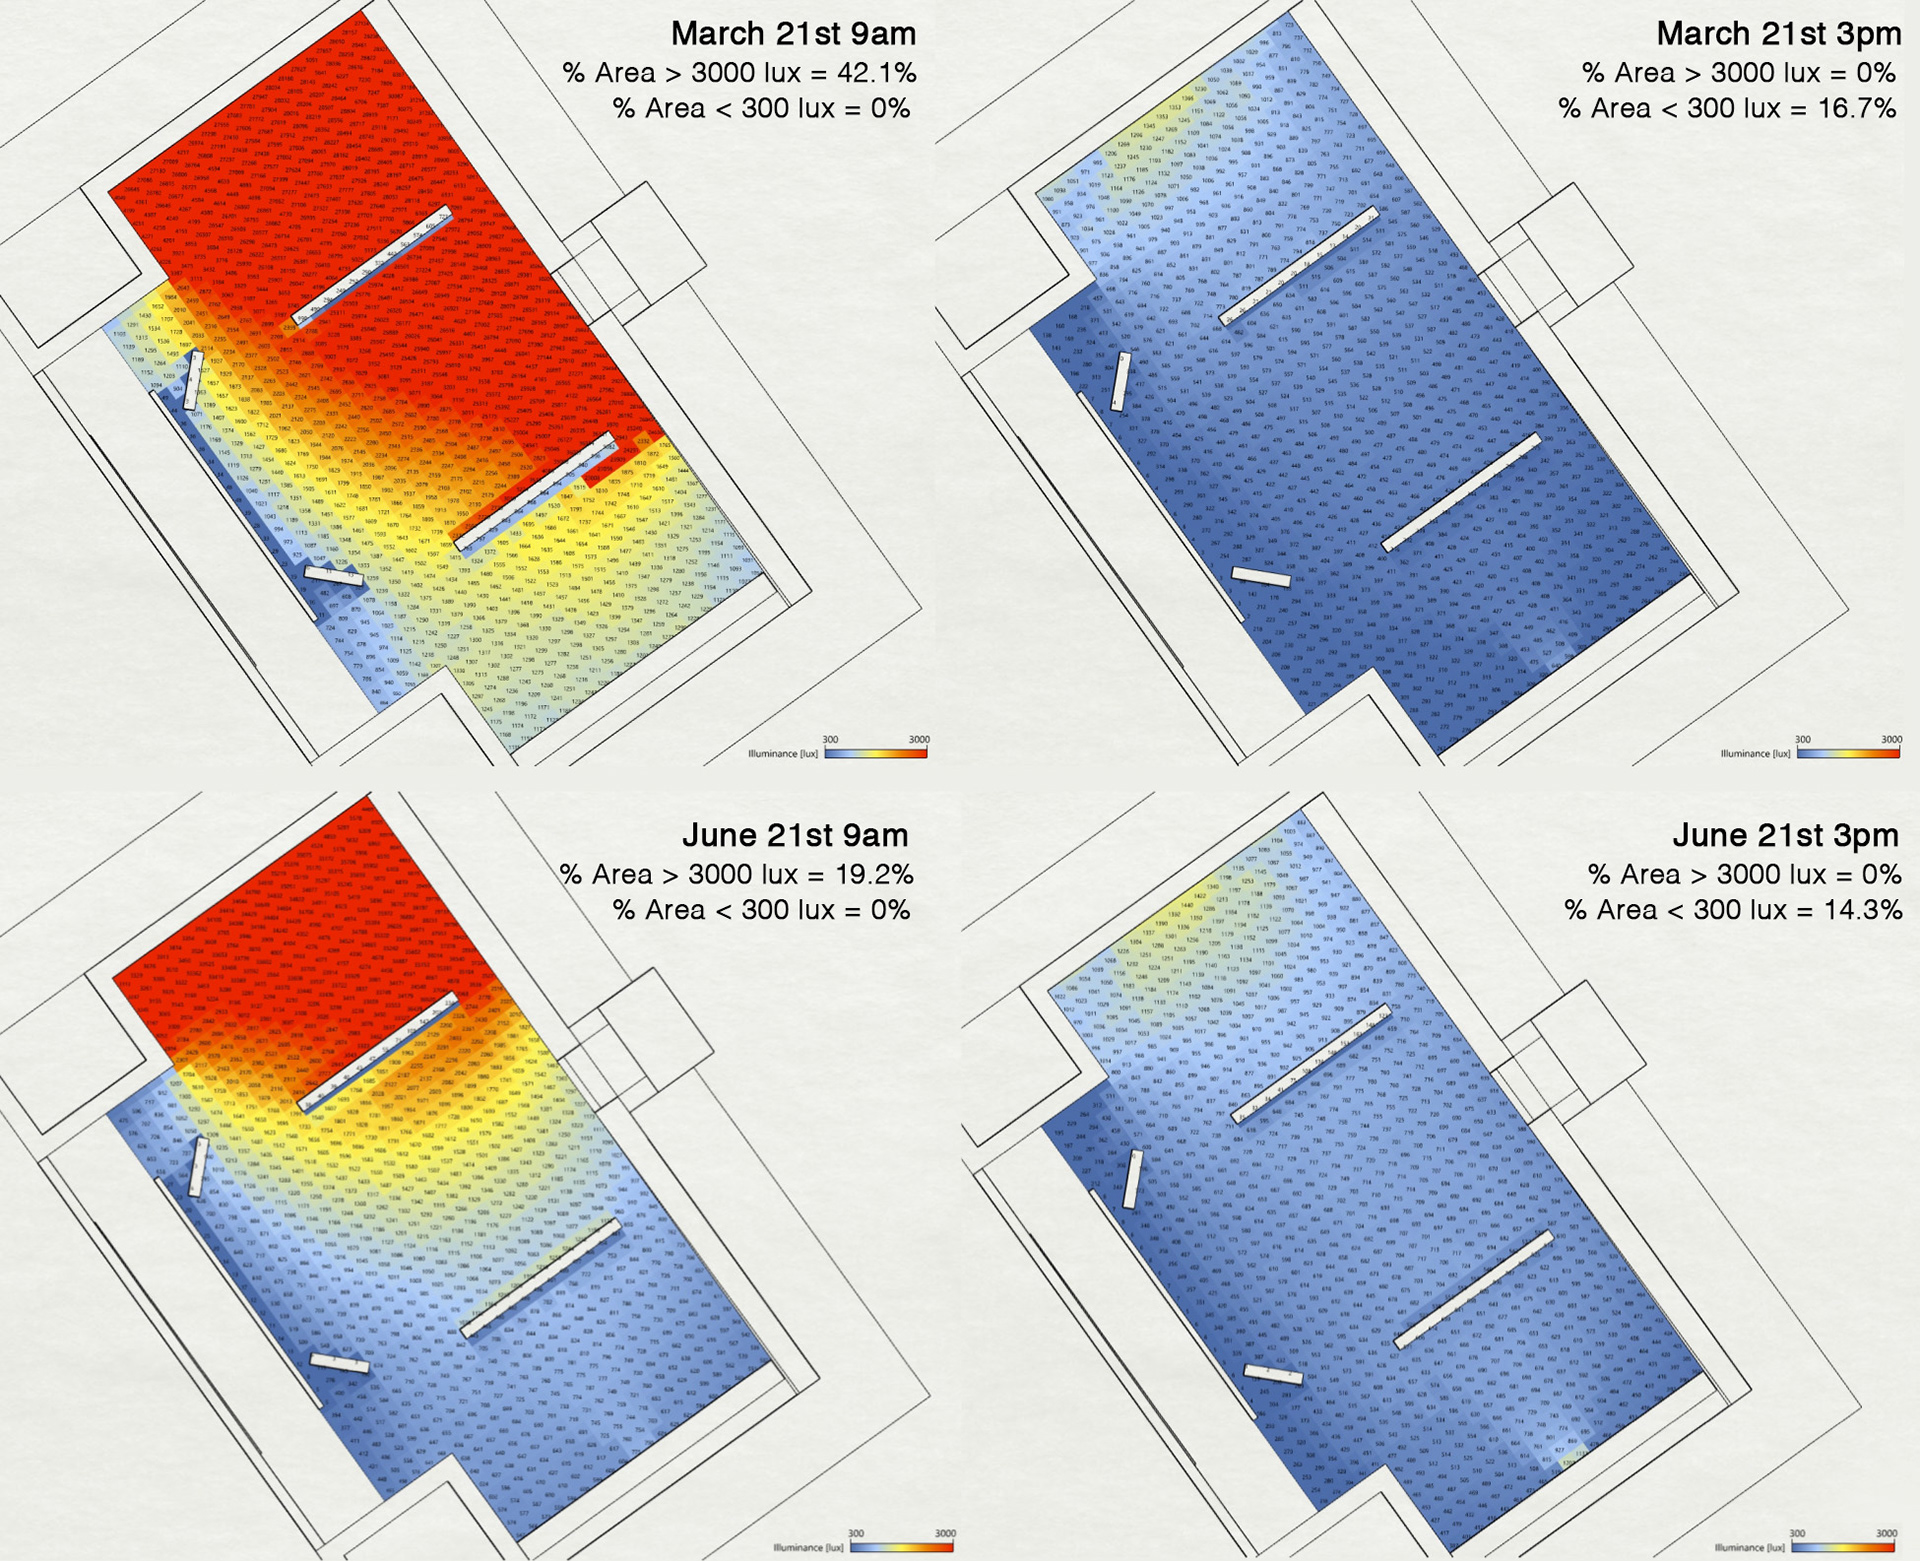
Grid Based Illuminance (E):
According to GSA (U.S. General Services Administration), the acceptable Illuminance levels for an office workspace is 500 lux, for a conference room is 300 lux and for public areas is 200 lux. The illuminance levels preferred in high precision job works can go up to 2000 lux. So, for this study, the acceptable Illuminance levels are set to 300-3000 lux.
According to GSA (U.S. General Services Administration), the acceptable Illuminance levels for an office workspace is 500 lux, for a conference room is 300 lux and for public areas is 200 lux. The illuminance levels preferred in high precision job works can go up to 2000 lux. So, for this study, the acceptable Illuminance levels are set to 300-3000 lux.
Spatial Daylight Autonomy(sDA), Annual Sunlight Exposure (ASE), Useful Daylight Illuminance (UDI):
The spatial daylight autonomy (sDA) is 97.5% which is more than the minimum amount of daylight required per floor area of 55%. Though the spatial daylight autonomy is good, it directly impacts the Annual Sunlight Exposure (ASE). The ASE for the design is 68.6% which is extremely high and much higher than the maximum permissible value of 10%. UDI is the percentage of occupied hours that get sunlight between 100 lux – 2000 lux. Anything less is considered underlit and more is considered overlit. The UDI for this space is 61.2%.
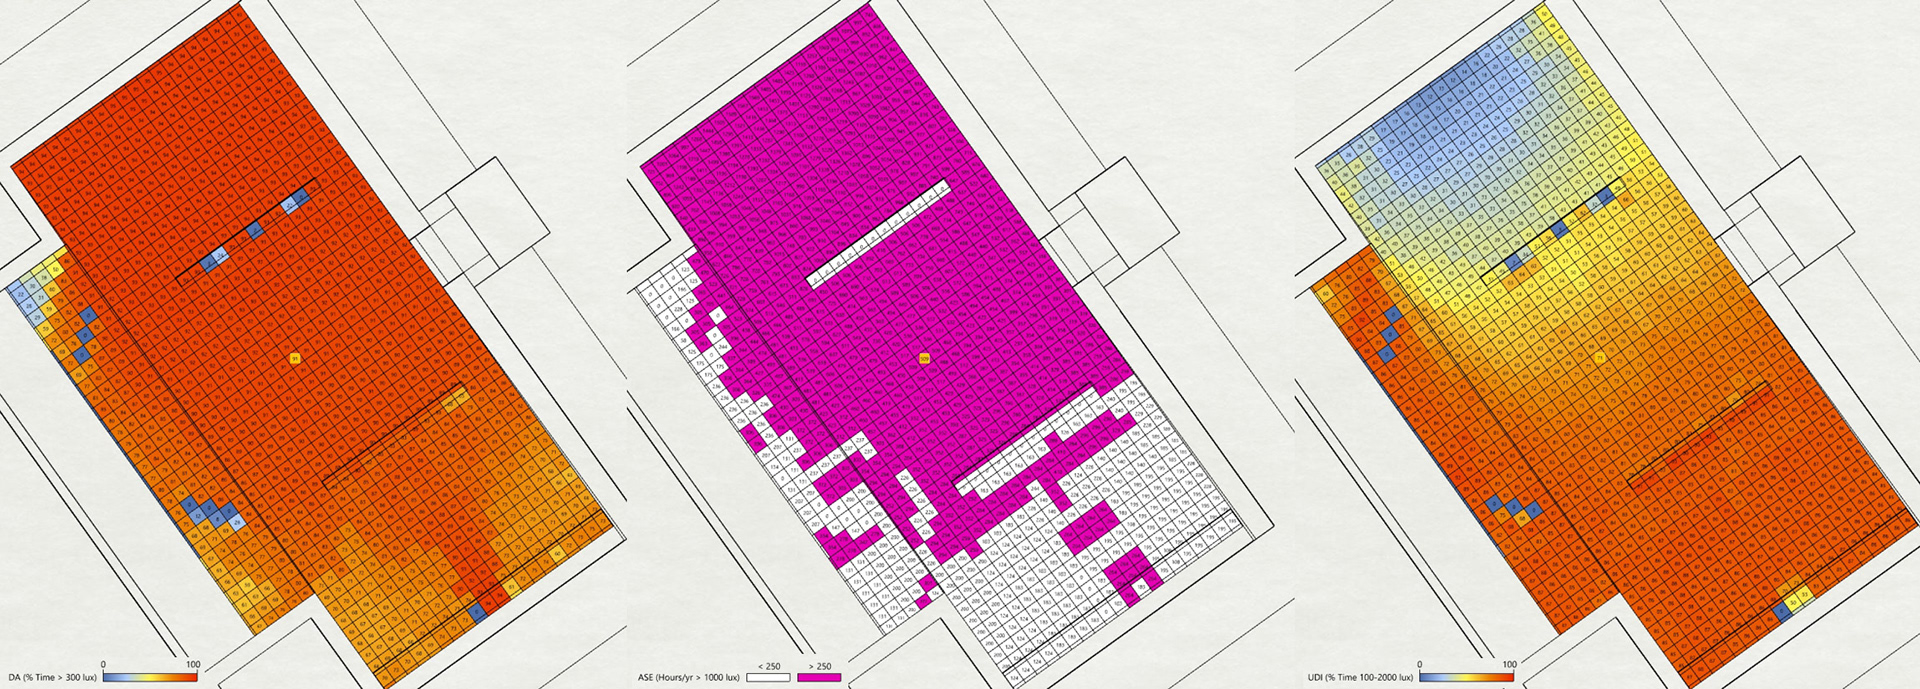
sDA, ASE and UDI
Unified Glare Rating (UGR), Visual Comfort Probability (VCP), Daylight Glare Probability (DGP):
In Summer the DGP is imperceptible as it is less than 0.35, at 9am the UGR is perceptible as it lies in the range of 13-22 and at 3pm it is less than 13 which is imperceptible. The VCP is disturbing at 9am as it lied between 40-60 and perceptible at 3pm.
In Summer the DGP is imperceptible as it is less than 0.35, at 9am the UGR is perceptible as it lies in the range of 13-22 and at 3pm it is less than 13 which is imperceptible. The VCP is disturbing at 9am as it lied between 40-60 and perceptible at 3pm.
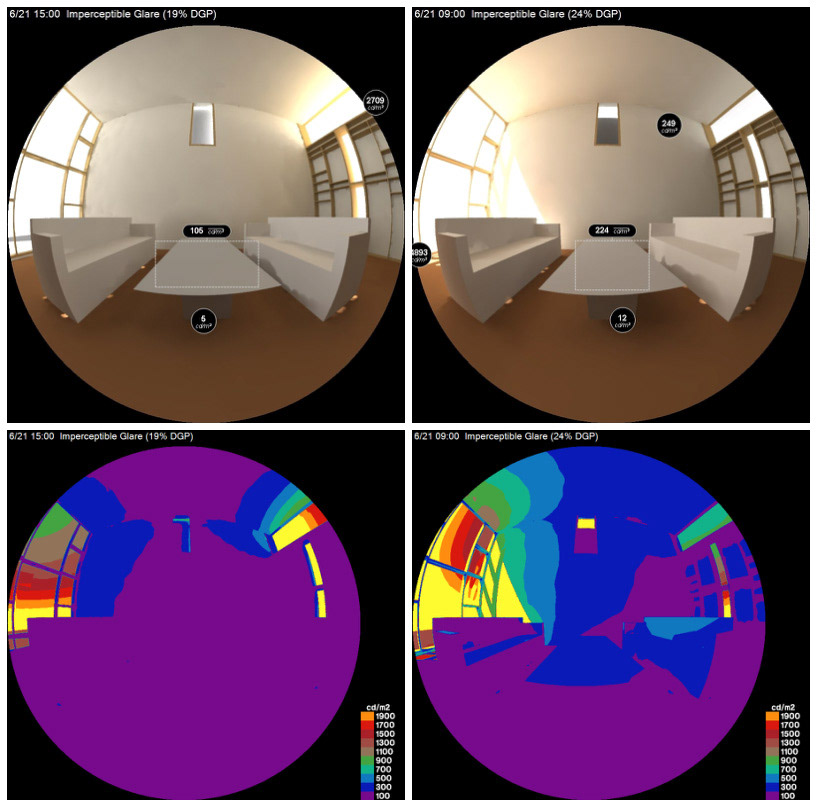
Luminance Renders
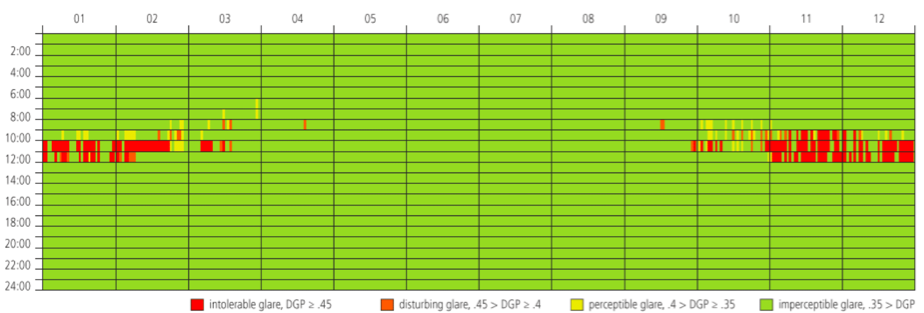
Annual Glare
part-4: thermal radiation study
The building was divided into 5 thermal zones based on functionality. The building assembly is customised to make a high performance building envelope.
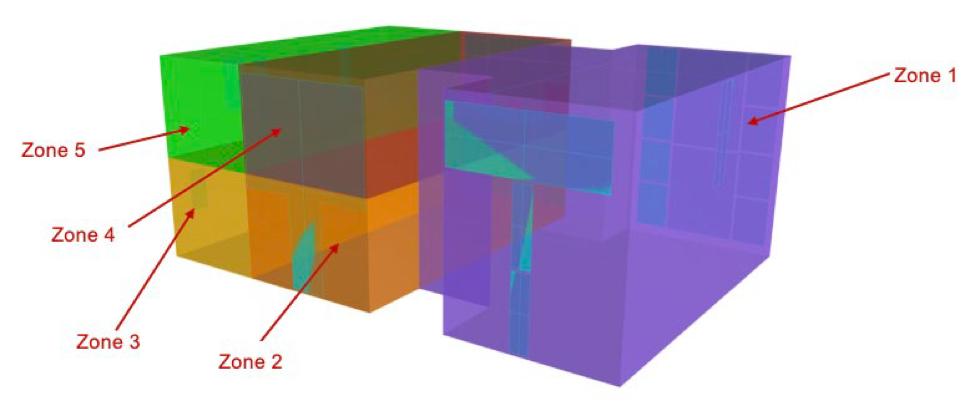
Thermal Zones
A high-performance wall assembly plays a vital role in reducing the heating loads of a building. It keeps the heat inside the house in winters and helps in heat related energy savings. IECC 2018 requires an R value of 16 for the walls and we propose a wall assembly of 13" and R-23. Apart from being well insulated, the walls should also be air-tight, water-tight and vapour-tight. The fifth condition to be considered is the thickness of the walls. The more layers you add, the lower the U-value gets.
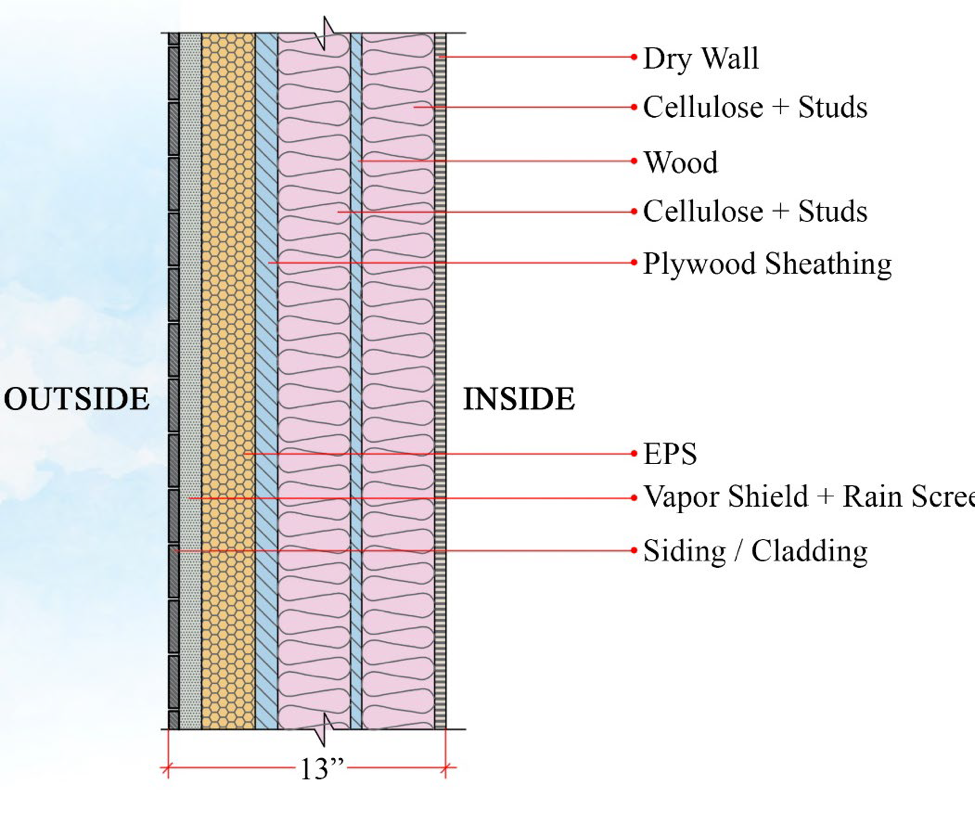
Wall Assembly
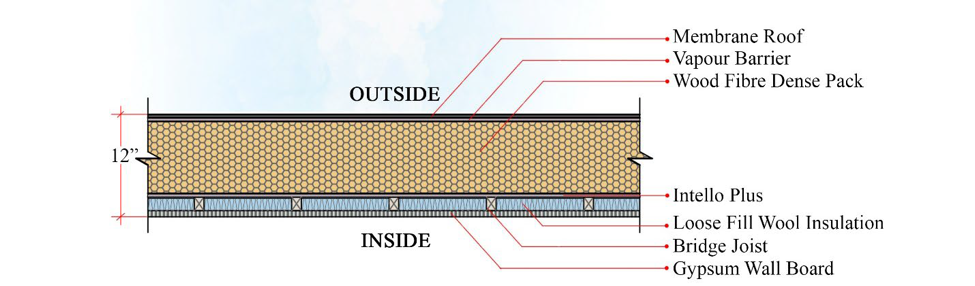
Roof Assembly
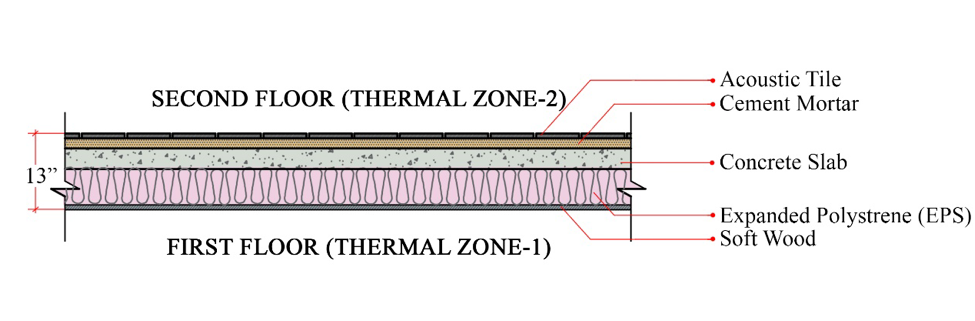
Floor Assembly
The roof assembly is composed of 2”X10” joists with dense packed wood fibre insulation between the joist finished with roofing membrane on the outside and GWB on the inside. The air barrier and vapour retarder were installed as well. The overall U value is 0.23, which is R 42. This value meets the IECC requirement at U = 0.023.
The high-performance floor slab can act as a thermal barrier between 2 or more thermal zones. When the exchange of heat between the thermal zones on different floors is not desirable, it is important to create a high-performing floor slab. The key to achieving a high-performing floor slab is adding a good insulation layer to the construction assembly.
Using ArchSIM Thermal Workflows, heating and cooling consumption per zone is calculated.
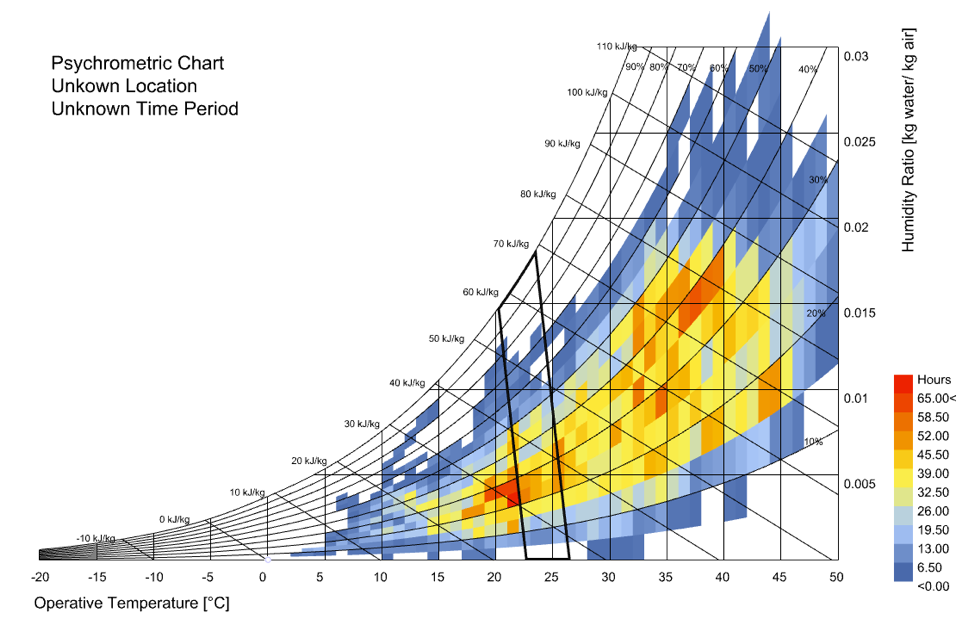
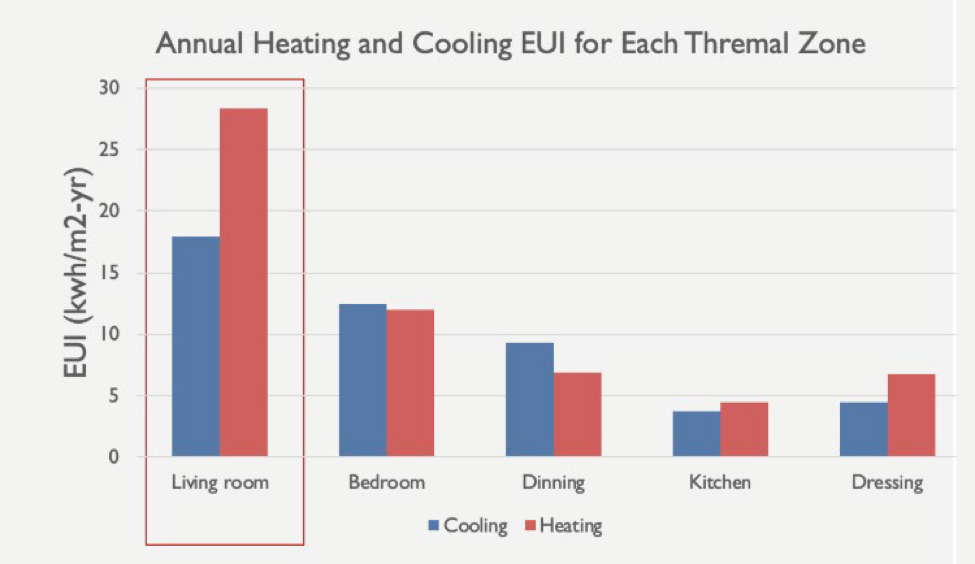
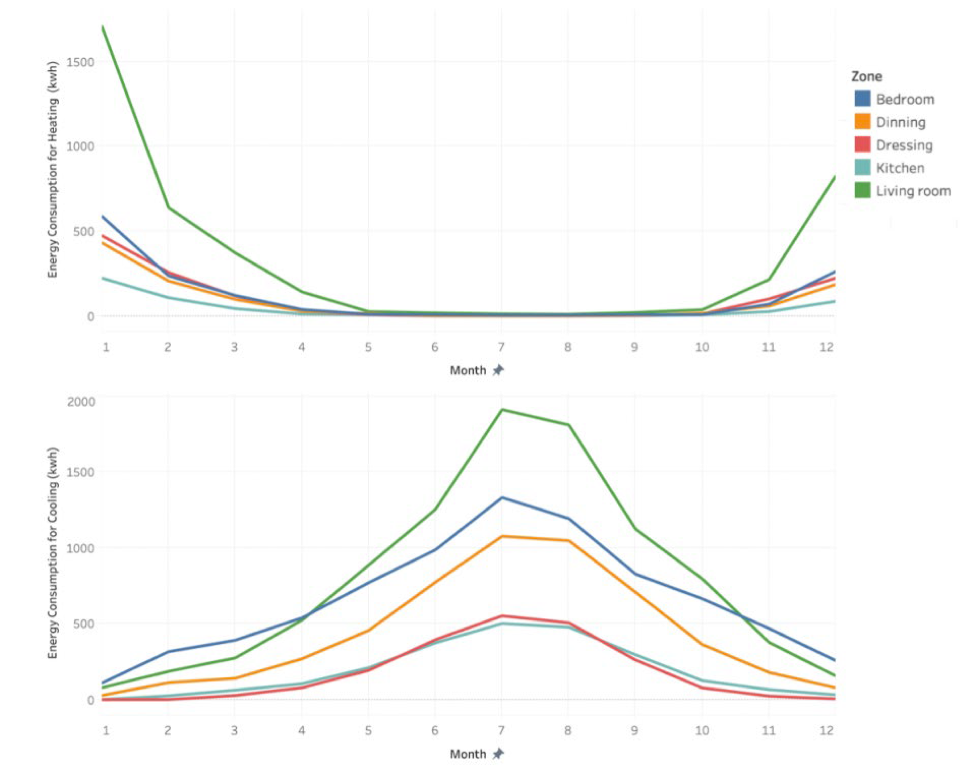
Psychometric Chart, Annual Cooling & Heating Energy and Energy Consumption break-down
INFERENCE:
The advanced building performance simulation tools like Rhino, Grasshopper, DIVA, ArchSim, EnergyPlus and Ladybug have made it possible to accurately quantify and analyze the outdoor and indoor virtual environments. Using these techniques, today, we can test out various design alternatives/combination of design alternatives to achieve the near perfect design. During the course of this class, we have used numerous simulations to understand and the analyze the building’s external and internal conditions in depth. From these understandings we were able to generate optimum building orientation, environmentally responsive landscape design, solar PV design, static shading device design, and various design alternatives to improve visual and thermal efficiency.