An Empirical Assessment of Socio-economic Impacts of Reduced Energy Supply in Rural India
For 48-711: Paradigms of Research in Architecture
By Afshan Rehman
1. Abstract
The introduction of rural electricity has direct links to poverty eradication, improved health, and can change the face of India’s gross domestic product (GDP), yet recent studies show that 60% of rural India still lives in the dark. 72% of power in India currently comes from thermal plants that use coal and most of these thermal plants have reached their maximum capacity. Unfortunately for human and environmental health, the government of India still considers burning coal as the most obvious solution to supply power for increasing demand. However, studies have shown that rural inhabitants have lower and more flexible electricity demands that may be met with a mix of alternative energy production. This study will determine the optimal number of hours and time of day to supply rural electricity by analyzing documentary records of peak activity time and usage by reviewing a number of diverse cases. To map the projected electricity demand of rural India, an Energy Map will be constructed using ArcGIS. Qualitative approaches including in-depth interviews, focused participant observations, and non-probability sampling will also be used to validate the results of the projected demand. This study hopes to create a plan to achieve 100% electrification in India to improve the health and prosperity of all Indians.
Keywords
Rural electrification, energy map, GIS mapping, location mapping, participant observation, qualitative survey, projected demand, peak activity time, renewable energy
2. Problem
2.2 Overview
2.2 Overview
As of 2018, the Indian Government claims that 91% of the villages in rural India are electrified. The truth is far from these statistics. According to standards set by Indian government themselves, only 10% of the houses need to have access to electricity for a village to be counted as electrified. In some cases this can also mean that only one house in the entire village has electricity. Electricity for household usage is an important infrastructure for elevating poverty. Currently electricity supply has been spread very non-uniformly based on how rich a village is[1].
To achieve the vision of 100% rural electrification we first have to understand why this hasn’t happened yet. Distance of villages from main grid, difficult terrains, small number of houses and smaller demand are a few of the many reasons. Using a conventional grid is expensive and loss of electricity during transmission will increase because of large distances[2].
2.2 Challenges due to remote location
In the areas of rural India that do not have electricity there is also lack of other basic infrastructure such as access to clean water and sanitation. There are no roadways either for the service employees to reach these towns and set up poles, wires, and substations.
India has a diverse landscape and many indigenous villages are in forests, deserts, and high mountains which makes connectivity more difficult. In Figure 1 we see that the places marked on India’s map that received electricity recently are the towns in the Eastern part of the country. It is geographically away from the rest of the country and also has sloping terrains similar to neighbouring international countries such as Tibet and Bhutan. The map on the right in Figure 1 shows that the population per sq.km is less compared to the rest of India. We see a correlation between geography, terrain, and population with rural India that is not electrified yet.
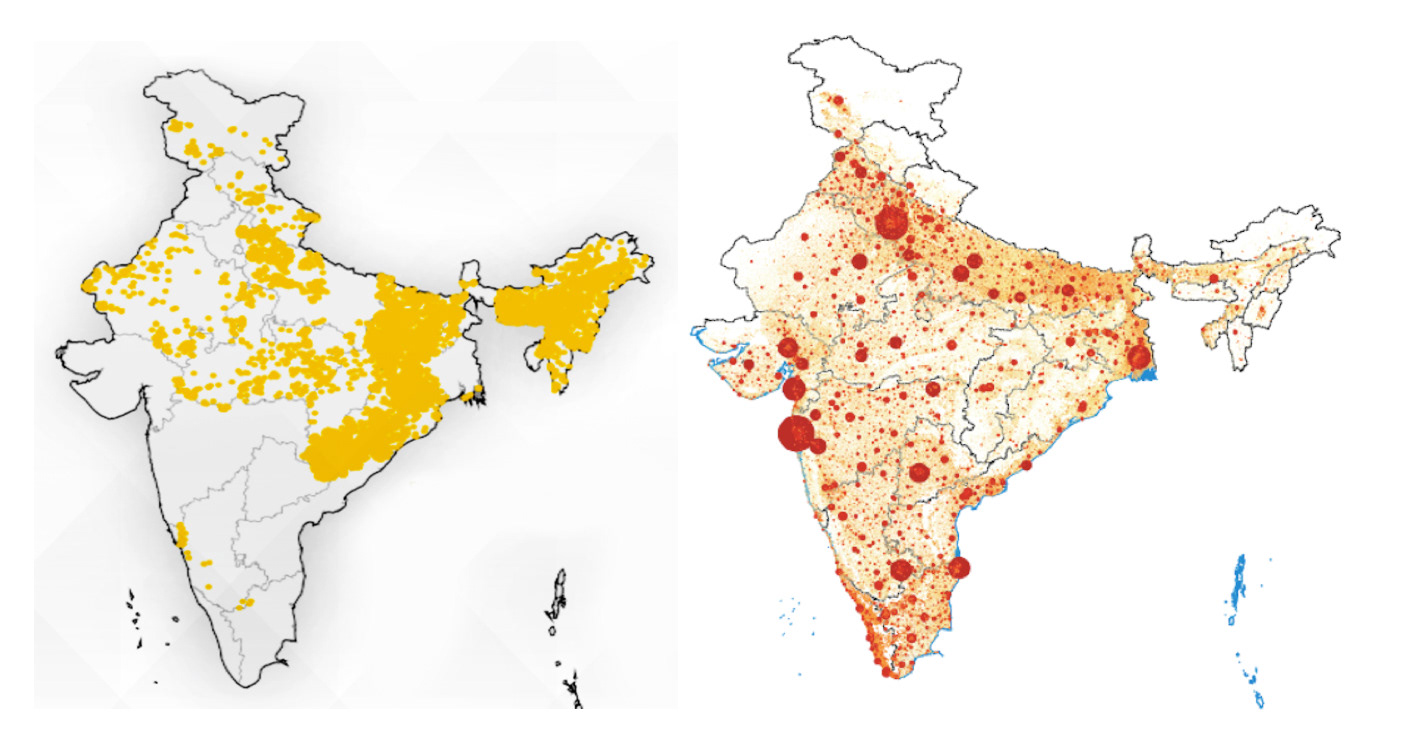
Figure.1 India Map showing villages with latest electrification and India Map with Population [L-R] [3,4]
Spatial patterns of energy usage are also based on states with intensive industrial growth. The electricity consumption per unit area is high in states like Madhya Pradesh and Orissa though they are the poorest states in India. This is because the industrial sector is moving to rural areas. The villages in these states are still not electrified. By understanding the spatial movement of energy usage in India, Indian electricity sector and policies can be planned better[5].
2.3 Challenges due to economic disparity
India’s overall per capita income is $1670 per year[6] and 27.5% of the population lives below the poverty line[7]. The urban-rural gap in India’s GDP is huge [Figure 2]. Despite three-fourths of the population living in rural India, it contributes to only one-third of the national income. One in five Indians live below the poverty line and 80% of India’s poor live in rural areas. The GDP gap between states is very high. Seven of the poorest states in India like Madhya Pradesh, Uttar Pradesh, and Bihar, account to 62% of India’s poorest population[8].
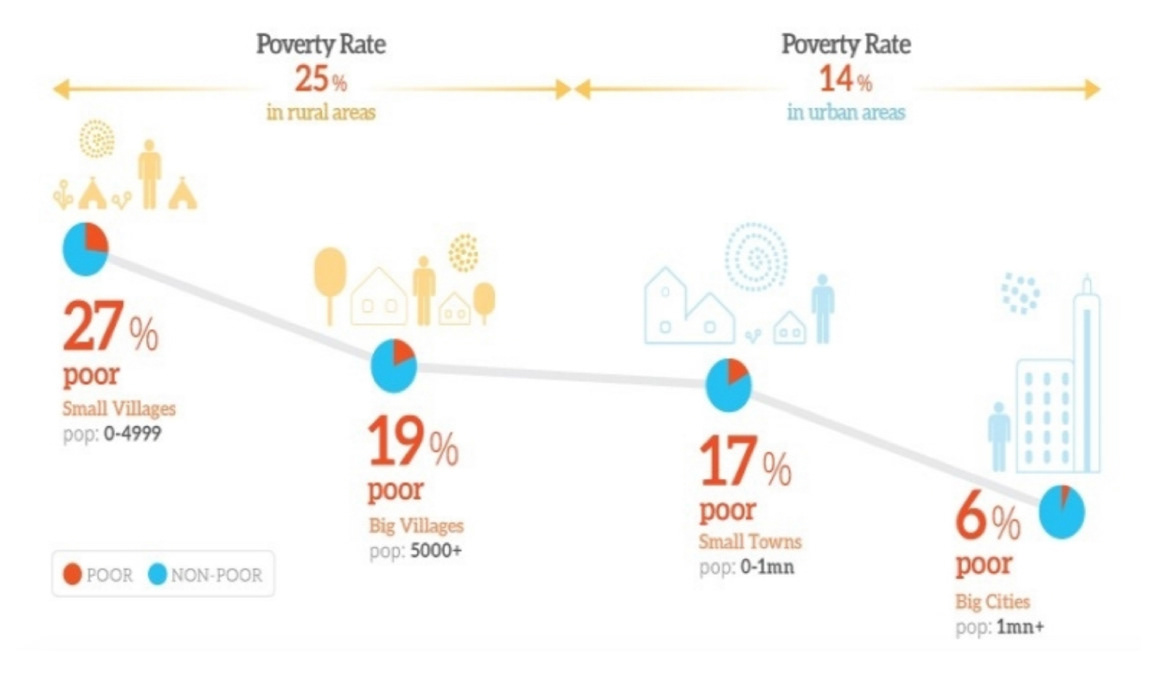
Figure.2 Percentage of poverty in rural vs. urban areas [8]
Due to this economic disparity a major portion of the rural population cannot afford to pay monthly electricity bills. They also cannot afford to buy any household appliances such as a refrigerator or a washing machine [Figure 3].
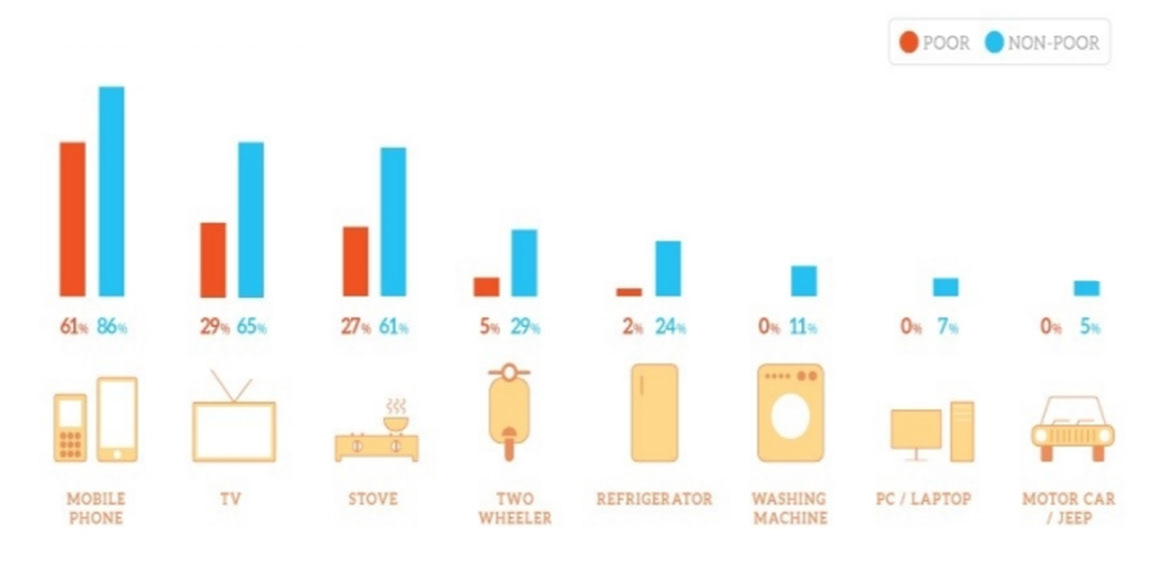
Figure.3 Percentage of assets owned by rural vs. urban homes [8]
There is also a correlation between economic disparity and remote location. A lot of villages with geographic disparity are home to scheduled tribes (SC & ST). Only 28% of India are SC and ST but 43% of the poor people belong to these tribes[8].
2.4 Challenges due to capacity restrictions of central grids of thermal plants
According to "India tops list of scrapped coal projects in pipeline since 2010: Study", two-thirds of India’s power generation comes from burning coal. The central power grids have huge power generation capacities but fall short due to two reasons – shortage of coal and lack of adequate distribution structure[9]. Despite having the fourth largest coal reserve in the world, untrained labor, lack of technology, and lack of competition are reasons for shortages of coal. Only 10 coal mines in India are mechanized and they produce less than one ton of coal per year compared to 25 tons in the United States. Privatizing coal industries will improve production drastically but increased efficiency in coal production is not the best solution since coal is a non-renewable source of energy and has high carbon emissions. Air pollution due to coal powered plants alone caused 82,000 deaths across India in 2015[10].
Inefficient transmission and distribution cause 20% loss in electricity which is the highest in the world[10]. When you count the length of primary and secondary transmission lines, India should produce 20% more electricity than the United States however it produces far less. To find out why this happens apart from the source to site source losses from a coal based power plant, detailed forensic engineering studies were conducted. Illegal tapping of lines, faulty meters, and fictitious power generation were some of the reasons found[11]. These inefficiencies cause a great loss to the country’s economy.
Several urgent reforms have to be implemented to fix these inefficiencies. Apart from switching to renewable sources of energy, expanding generation, managing demand, and improving efficiency of inter-regional transmissions, management information systems have been set up to monitor technical losses of electricity. In 2008-2009, aggregated losses were averaged to 28% at the national level. In order to reduce this to 15%, a Restructured Accelerated Power Development and Reform Program was developed by the Government of India[12].
3. Solution
3.1 Research Approach
3.1 Research Approach
Several case studies of electrified rural India show that people in rural India are content with receiving only a few hours of electricity on a daily and regular basis. Ranidhera, a small village in Chhattisgarh, used jatropha seeds to extract biofuels and use this to produce electricity. Winrock International India implemented this through decentralised power plants that used oil extracted from these seeds alone. The power plant runs for four hours a day and is able to meet the demand of the entire village. When the researchers looked at the entire life cycle of the jatropha seeds method they realised that it is 50% more environmentally friendly than other options. This method of using the oil from local shrubs grown on marginal lands as a biofuel is a great option for rural areas that are in remote locations, have a small population and have minimum requirements for electricity[13].
Another study by M. Alkin et al. called 'Factors affecting household satisfaction of Electricity' is based on a survey conducted with 8568 homes in rural India. This survey was conducted in the six most populous states of India that receive electricity but only for a few hours or receive poor voltage. By conducting this survey, the authors wanted to answer the burning question of whether bad quality electricity is worse than no electricity. Limited hours and fluctuating power disrupts comfortable lifestyles and social life in general. There were multiple dimensions to this survey. The first was based on quality. Quality was further divided into durability, reliability, and voltage. The average electricity received by the sample was between 5-13 hours per day. Reliability was measured on a scale of 0-2 with 0 being the least reliable and voltage was calculated as number of days in a month that had poor voltage. Out of these 3 factors, duration seemed to have the most correlation with economic growth and comfort. The aim of this survey was to find the correlation between economic growth with good quality of electricity vs. economic growth of towns that have no electricity. It was found that introduction of electricity with poor voltage increases the economy by 9% whereas increasing the quality of electricity increases the economy by 28%[14].
From an overview of the problems and hypothesis of other researchers’ work, the best possible solution to help India reach 100% electrification fast and also improve the lifestyle and economy of the villagers is by providing a few hours of electricity at a constant voltage at a peak activity time. The overarching aim of this paper is to figure out the optimum number of hours when electricity is required and the exact time of the day when this is preferred. To propose this solution of providing optimum supply we first need to predict the demand. This will be done using two methods –GIS mapping and a qualitative survey. The timeline to finish this research would be 5 months. An energy map will first be created using GIS data of India and the second part of the research has to be done in the field will take approximately 3 months.
3.2 Energy Mapping
An energy map is a map with information about energy demand, energy supply, stations, sub-stations, transmission lines, closest sources of renewable energy, and closest power grid. Since there is no energy map available for India, we will have to map the energy demand using GIS maps. From an overview of the problems we see that there is a correlation between location and poverty. There are several such correlations between gender, income, education, etc. We can predict the energy demand by mapping out population and their income.
The layers for GIS analysis along with spatial information will be – Population, Gender, Income, Median age, Livelihood, Lifestyle and Literacy. We know from the literature study that there is a major correlation between each of these segments and energy use. By studying these sets of data, peak demand for rural villages can be predicted. Data about lifestyle and livelihood will also give a vague idea about peak activity time and number of hours’ electricity is required.
One shortcoming in this method of research is that the availability of India’s GIS data is limited. There are many open source websites that have spatial information about India but their authenticity is doubtful. To confirm the accuracy of this data, one has to cross check this information with demographic zoning maps provided by national, state and local governments [Figure 4].
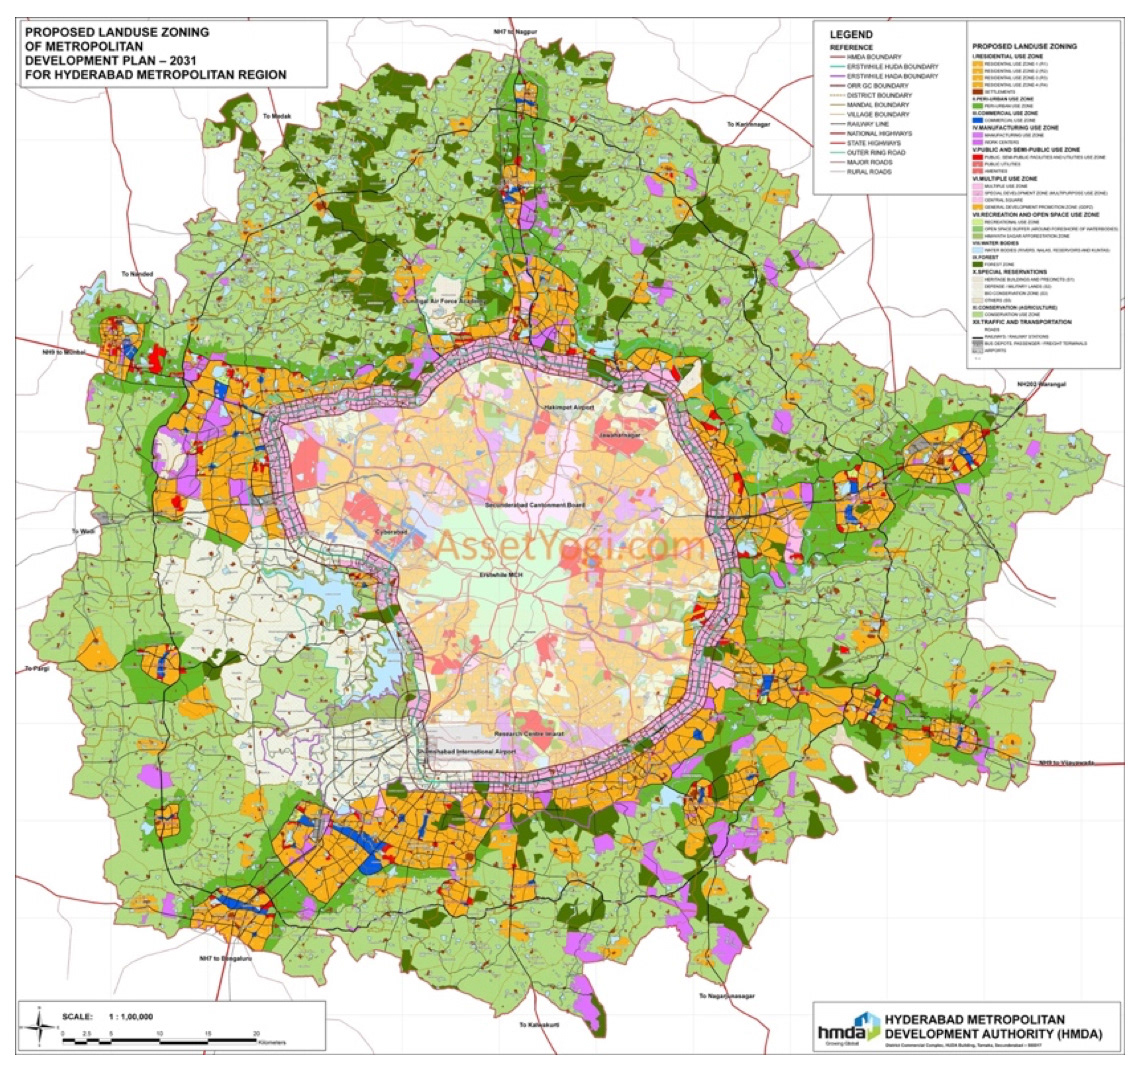
Figure.4 An example of a demographic zoning map of Hyderabad, Telangana, India [15]
3.3 Practical and Non-probability sampling
From GIS Mapping, we can get the predicted energy demand and a rough figure for peak activity time. To establish a final variable for peak activity time and the number of hours’ for which electricity is required, an applied qualitative social survey will be conducted on field. For sampling and data collection, a non-probability sample will be used. Because India has disparate and contrasting cases, human judgment is required to select people, villages, and units[16].
The type of samples for a non-probability survey will be based on convenience, contrasting cases, typical cases, critical cases, snowball and quota. Other factors to consider are target population, sample size, type of data collection and predicted percentage of error. Census data will help decide a sampling plan based on budget and time limit. After deciding the sample size, the survey questions will be designed and evaluated. Due to literacy rate being low in rural India, care has to be taken to ensure that the questions are easily understandable, respondents are able to recall basic information from memory, and that they are able to express their views in the most appropriate way. These surveys will also have to be translated to various vernacular languages. To make the results stronger, cognitive interviews and field observations will also be conducted[16].
After the data is collected, the probability of error has to be calculated. Non sampling bias, sampling bias, and sampling variability are three types of errors. A cleverly designed sample will minimize errors. Care will be taken to mitigate one type of error as reducing all three components can reduce the credibility and validity of the total sample[16].
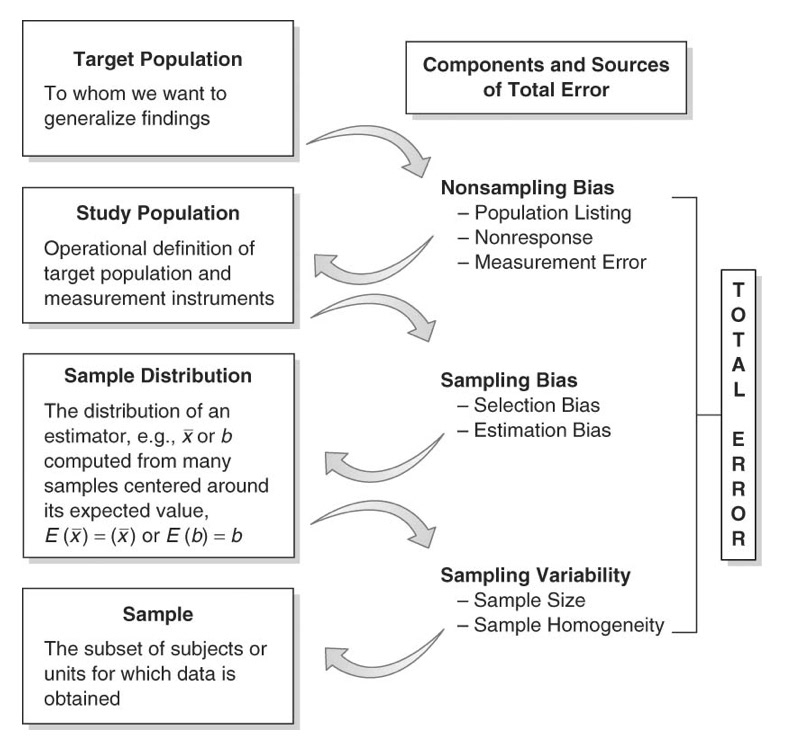
Figure.5 Methods to decompose total error[16]
4. Evaluation
The anticipated findings from GIS mapping and qualitative social survey will give us the projected demand, peak activity time and the number of hours for which electricity is required in rural India. The impacts of the new projected demand will be compared to forecasted values of what the economic, social, and environmental impacts of 100% electrification would be if we aimed at 24x7 electricity in rural villages.
4.1 Economic Index
An indicator based analytical approach will be used to compare the economic expenditure of the proposed supply and 24x7 supply. The indicators to calculate these will include installed capacity, energy generation, energy sales and revenue. The predicted cost for providing 24x7 electricity is approximately $200 billion. If the expansion is proposed at one go without changing any reforms, the losses due to inefficiency alone would cost more than $11 billion. By introducing electricity slowly, an efficient energy model can be developed which replaces the street lights with LED bulbs. It is also easier to get investment from the World Bank if the plan is phased out. Energy efficiency scale-up programs and clean technology funds can be the investors if the energy production is hybrid.
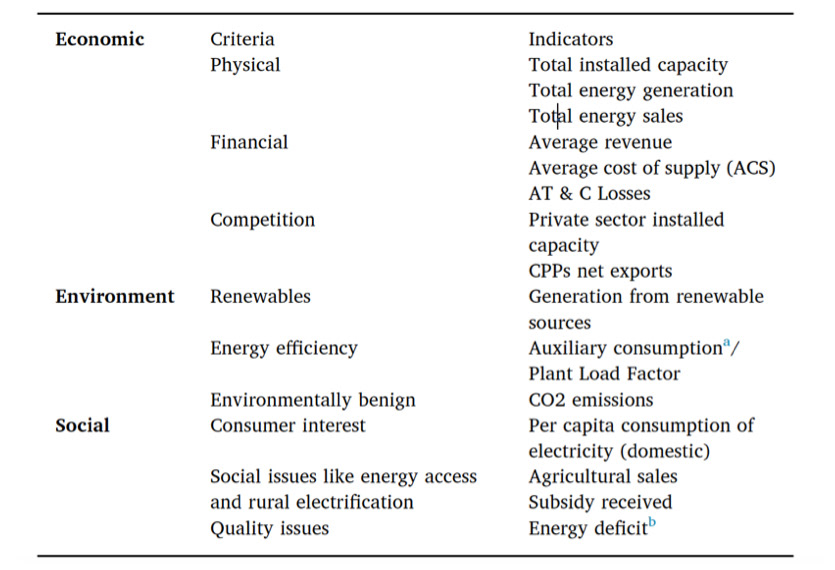
Figure.6 Selection of Indicators based on mandate dimensions[17]
4.2 Social Index
The history and evolution of US rural electrification shows that the introduction of electricity significantly improved the life of its citizens. Initial centralised electricity generation gave a better life to the citizens of US by providing reliable and cheap energy. In the 1970s the price of fuel became higher and by 1990s multiple independent power producers emerged and policy makers began to acknowledge their existence and encourage innovation. Several methods and technologies were studied in terms of its lifecycle cost and a hybrid solution was proposed that was flexible and used both central grid and renewable sources using demand response. The main aims of energy supply are wellness, reliability, and low cost. Progressive lowered costs can be achieved by using a combination of demand response, micro grids, energy storage, and efficient power plants. India can learn from the research of US rural electrification and study how a hybrid plan can continue improving the social life of the villagers[18].
Not every town or unit will show positive social response. There will be some unpredicted results that will be analyzed under social index. After rural electrification in Namibia was introduced, researchers examined schools, hospitals, and small businesses in these villages to study the social impact of electrification. The results were unanticipated. Schools did not find as much transformation as expected. The main use of electricity was lighting and classes were held in the day. The staff in these Namibian schools were not aware of technology enhanced teaching methods such as photocopies, projectors, and computers, so they did not use them. They also prioritised the need for other resources such as books, furniture, and sanitation more than electricity. Health care facilities showed direct transformation, especially with the use of operation theatre lighting, refrigeration, and battery powered back up storage. It also increased staff retention and a sense of security. Small businesses showed the most development since their use of refrigeration, lighting, and entertainment was the most. They were using alternate methods of providing these which increased their monthly expenditure and saw drastic savings by introduction of electrification[19].
By understanding social impacts of electrification in the first phase, when India eventually moves to 24x7 electricity for all, variations can be made based on their social impacts.
4.3 Environmental Index
To reach India’s goal of 100% electrification, the growth has to be sustainable from various sources. India has shown commendable progress in terms of sustainable growth, yet it is still far behind compared to other countries. 65% of electricity is still sourced from fossil fuels and it has to reduce at the rate of 40% by 2030 to meet universal standards of carbon emissions. The carbon emissions from electricity sector alone are 44%. Given that India has geographical disparity, there is a huge potential to expand the scope of PV micro grids and several other types of renewables such as hydro, wind and bio-fuels. Increase in sustainable methods will cause increase in economic expenditure due to high initial costs[17]. A hybrid combination of PV/battery or PV/diesel can be used to reduce investment costs and reduce carbon footprint. Since the predicted demand and peak activity time will be lower as a result of the qualitative study minimum PV panels can be installed. According to previous research basic hybrid PV grids to provide 6-8 hours of electricity per house will suffice. An option of charging mobiles, running one small kitchen equipment of 60W and running 2 fluorescent lights of 18W each is ideal for a rural village in Telangana, India[20].
Long term partnerships and various investors are required for expansion of renewable sources of energy. To help the entire nation get electricity as soon as possible, hybrid grids can be made that switch between renewable and non-renewable sources of energy that can slowly expand to complete renewables.
5. Conclusion
This research will give a detailed report of the predicted demand, peak activity time, and number of hours in a day that require electricity in rural villages. The information gained from this research evaluation will help the government and policy makers make informed choices to implement rural electrification in phases. Given the urgency of this proposal several methods of research have to be done simultaneously and implemented in tandem to this particular method. This study hopes to create a plan to address the more flexible demands of the rural population of India.
5.1 Benefits of Rural Electrification
To support India’s growing development and to create equal opportunities for all citizens, rural electrification is an urgent need of the day. Introduction to electricity has direct benefits to socio-economic lifestyle. There will be a direct progress in education, healthcare and household. The major livelihood of rural India is farming and introduction to electricity can improve efficiency in production by additional use of water pumps, farm machinery, grain crushers, etc. This increased efficiency and accuracy will help the farmers save time and sell more produce.
Opportunities created for income generation due to electricity will in turn create opportunities for increased supply and demand. Rural inhabitants will become financially independent and will be able to afford 24X7 electricity that will be introduced in the next phases of electrification.
5.2 Limitations
To solve the issue of rural electrification, a range of options have to be explored. Some of these include fuel type, source of fuel reserve, increased efficiency during production and transmission, challenges faced due to remote location, funding avenues, delivery price of energy, access to modern technology, ownership of power grids, etc. Though, all these areas of interests are equally important, due to the limitation of time, wont be covered in the scope of this research.
6. References
[1] "The rural electrification in India". The wire. 29 April 2018.
[2] G.D. Kamalapur, R.Y. Udaykumar, (2010, December). Rural electrification in India and feasibility of Photovoltaic Solar Home Systems. International Journal of Electrical Power & Energy Systems, Volume 33, Issue 3, 594-599.
[3] “Map of last 18,000 villages of India Electrified.” Scroll. May 2019.
[4] “Despite Progress under Nitish Kumar Bihar is still at the bottom rungs of India’s poverty ladder.” Scroll. 18 August 2015.
[5] “India’s Chaotic and Messy use energy.” World Bank Organization. October 30, 2015.
[6] "India's per capita income grows by 8.6% to Rs 0.43 lakh in FY18.” Times of India. Retrieved 8 January 2019.
[7] Poverty estimates for 2004-05. Archived 14 September 2008 at the Wayback Machine, Planning commission, Government of India, March 2007.
[8] “India’s Poverty Profile.” World Bank Organization. May 27, 2016.
[9] "India tops list of scrapped coal projects in pipeline since 2010: Study". Retrieved 13 July 2018.
[10] “What’s keeping India in the dark?” End Poverty in South Asia, World Bank Organization. January 31, 2019.
[11] Uwe Remme; et al. (February 2011). "Technology development prospects for the Indian power sector" (PDF). International Energy Agency France; OECD.
[12] “India Power Sector”. World Bank Organization. April 31, 2010.
[13] Simon Michael Gmunder, Rainer Zah, Somnath Bhatacharjee, Mischa Classen, Prodyut Mukherjee, Rolf Widmer, (2009, November). Life cycle assessment of village electrification based on straight jatropha oil in Chhattisgarh, India. Biomass & Bioenergy, Volume 133, 2020, February.
[14] Aklin, M., Cheng, C. Y., Urpelainen, J., Ganesan, K., & Jain, A. (2016). Factors affecting household satisfaction with electricity supply in rural India. Nature Energy, 1(11). https://doi.org/10.1038/nenergy.2016.170
[15] “Proposed Land use zoning of Metropolitan Development Plan-2031”, Hyderabad Metropolitan Region. https://hmda.gov.in. November, 2019.
[16] Rog, D. J., & Bickman, L. (2009). The SAGE Handbook of Applied Social Research Methods: Vol. 2nd ed. SAGE Publications, Inc.
[17] Sarangi, G. K., Mishra, A., Chang, Y., & Taghizadeh-Hesary, F. (2019). Indian electricity sector, energy security and sustainability: An empirical assessment. Energy Policy, 135. https://doi.org/10.1016/j.enpol.2019.110964
[18] Tuttle, D. P., Gülen, G., Hebner, R., King, C. W., Spence, D. B., Andrade, J., … Duncan, R. (2017). The History and Evolution of the U.S. Electricity Industry. The Full Cost of Electricity (FCe-). Retrieved from http://sites.utexas.edu/energyinstitute/files/2016/09/UTAustin_FCe_History_2016.pdf%0Ahttp://energy.utexas.edu/files/2017/05/UTAustin_FCe_Exe_Summary_2017.pdf
[19] Wamukonya, N., & Davis, M. (2001). Socio-economic impacts of rural electrification in Namibia: comparisons between grid, solar and unelectrified households. Energy for Sustainable Development, 5(3), 5–13. https://doi.org/10.1016/S0973-0826(08)60272-0
[20] Loka, P., Moola, S., Polsani, K., Reddy, S., Fulton, S., & Skumanich, A. (2014). A case study for micro-grid PV: Lessons learned from a rural electrification project in India. Progress in Photovoltaics: Research and Applications, 22(7), 733–743. https://doi.org/10.1002/pip.2429